Multiple Choice
Refer to the diagrams below.The solid lines are production possibilities curves;the dashed lines are trading possibilities curves.The trading possibilities curves suggest that the terms of trade are: 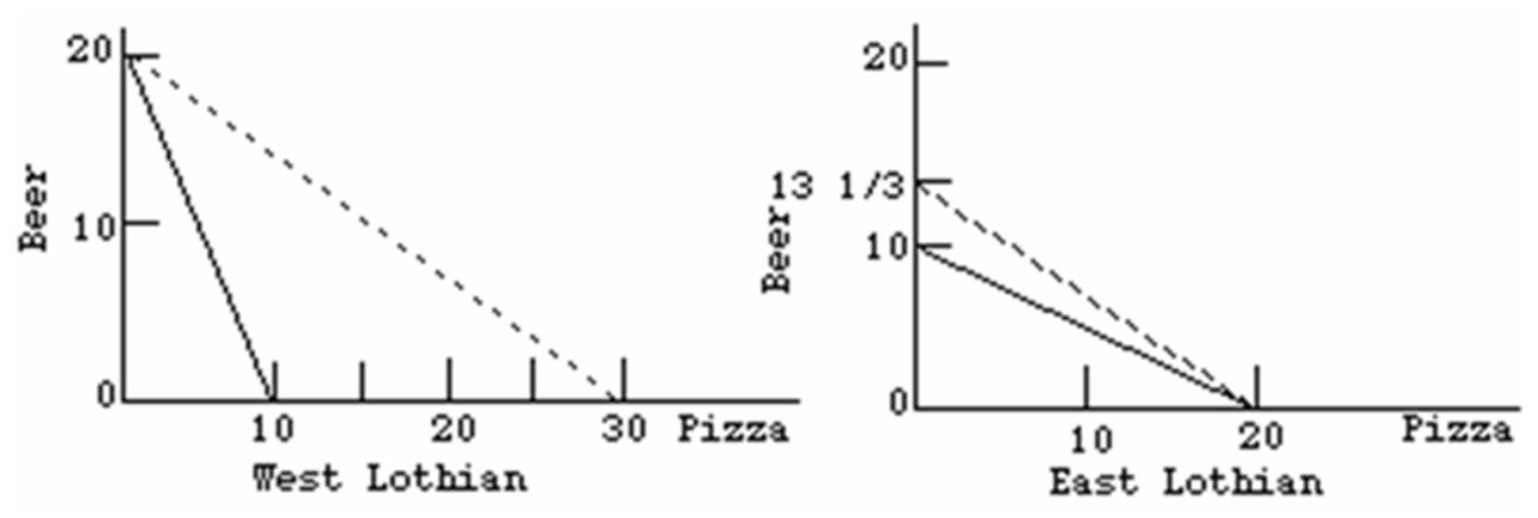
A) 1.5 beers for 1 pizza.
B) 1 beer for 2 pizzas.
C) 2 beers for 1 pizza.
D) 1 beer for 1.5 pizzas.
Correct Answer:

Verified
Correct Answer:
Verified
Q71: A nation will import a particular product
Q85: A nation's import demand curve for a
Q146: Refer to the diagram below in which,
Q154: In terms of absolute volume, world trade
Q170: Which combination of policies would entail the
Q173: <img src="https://d2lvgg3v3hfg70.cloudfront.net/TB2474/.jpg" alt=" -Refer to the
Q175: The following shows the Production possibilities tables
Q176: <img src="https://d2lvgg3v3hfg70.cloudfront.net/TB2474/.jpg" alt=" -Refer to the
Q177: The following is the Production possibilities data
Q181: Assume that by devoting all its resources