Multiple Choice
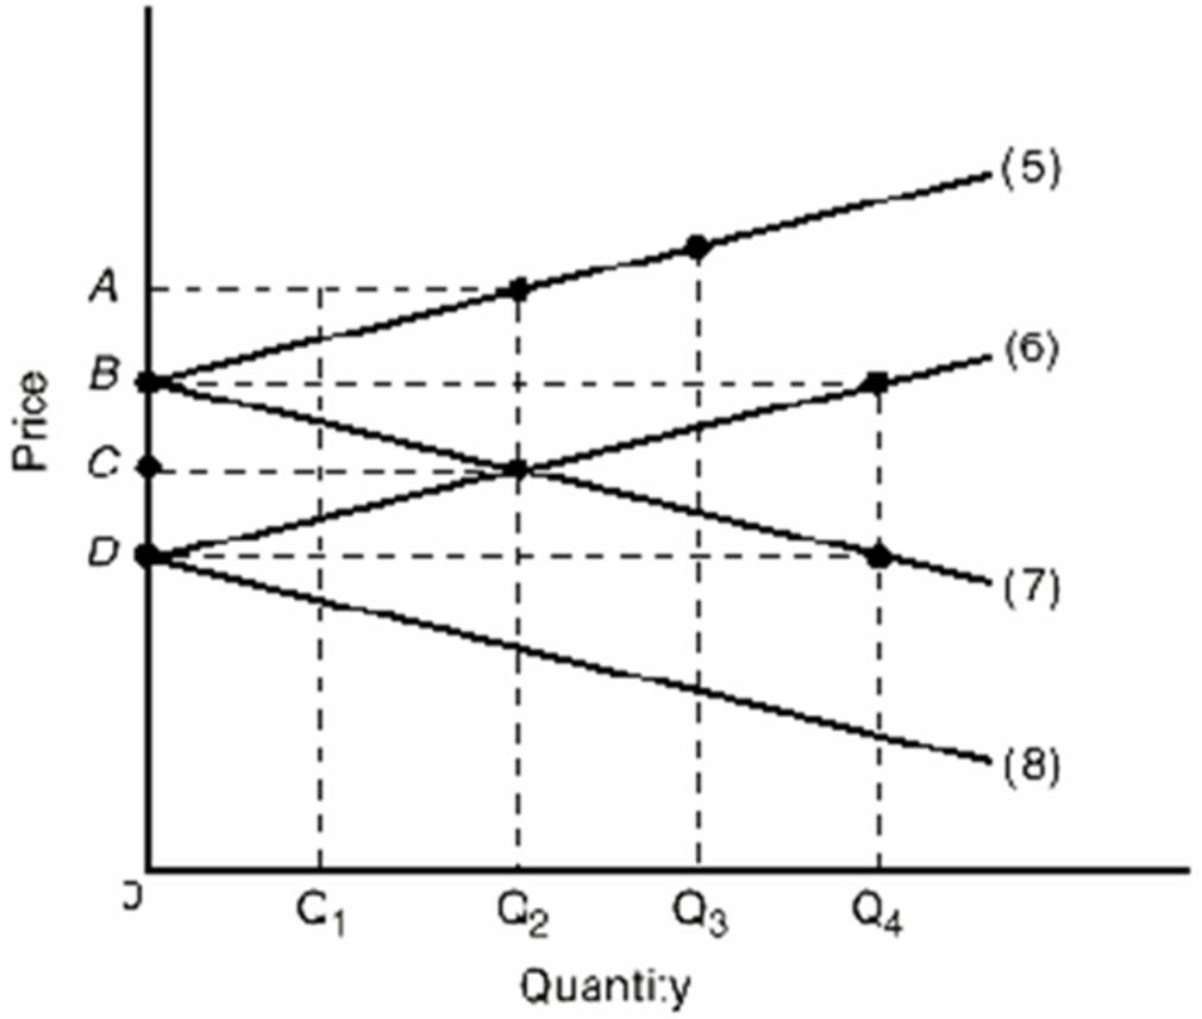
-Refer to the above graph which shows the import demand and export supply curves for two nations that produce a product.The import demand curves for the two nations are represented by lines:
A) 5 and 6.
B) 5 and 7.
C) 6 and 8.
D) 7 and 8.
Correct Answer:

Verified
Correct Answer:
Verified
Q15: Which is responsible for the major decrease
Q57: Production possibilities data for two countries,Alpha and
Q58: <img src="https://d2lvgg3v3hfg70.cloudfront.net/TB2474/.jpg" alt=" -Refer to the
Q63: The following data is for the hypothetical
Q64: The data in the tables below,show that
Q67: The following shows the Production possibilities tables
Q124: The cheap foreign labour argument suggests that:<br>A)to
Q149: The proponents of the cheap foreign labour
Q186: The World Trade Organization was established by
Q220: International trade based on the principle of