Multiple Choice
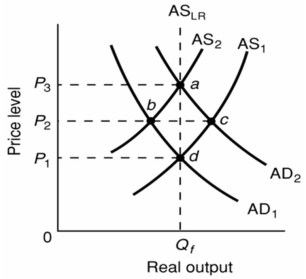
-Refer to the above diagram.The initial aggregate demand curve is AD1 and the initial aggregate supply curve is AS1.In the long run,demand-pull inflation is best shown as:
A) a shift of aggregate demand from AD1 to AD2 followed by a shift of aggregate supply from AS1 to AS2.
B) a move from d to b to a.
C) a shift of aggregate supply from AS1 to AS2 followed by a shift of aggregate demand from AD1 to AD2.
D) a move from a to d.
Correct Answer:

Verified
Correct Answer:
Verified
Q2: <img src="https://d2lvgg3v3hfg70.cloudfront.net/TB2474/.jpg" alt=" -Refer to the
Q6: <img src="https://d2lvgg3v3hfg70.cloudfront.net/TB2474/.jpg" alt=" -Refer to the
Q10: <img src="https://d2lvgg3v3hfg70.cloudfront.net/TB2474/.jpg" alt=" -Refer to the
Q20: The short-run aggregate supply curve is upward-sloping
Q25: The long-run aggregate supply curve:<br>A)is downward sloping.<br>B)is
Q40: Prominent supply-side economist Arthur Laffer has argued
Q57: If government fiscal policy is used to
Q73: In the short-run, demand-pull inflation increases<br>A)real wages,
Q92: Assuming prices and wages are flexible, a
Q100: The short-run aggregate supply curve is vertical,