Multiple Choice
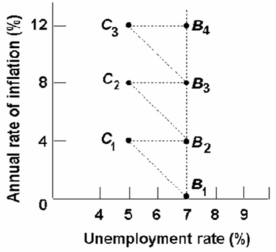
-Refer to the above diagram and assume the economy is initially at point b1.According to the adaptive expectations theorists,the long-run relationship between the unemployment rate and the rate of inflation is represented by:
A) the line connecting B1 and C1.
B) the line through B1,B2,B3,and B4.
C) the line connecting C1 and B2.
D) any line parallel to the horizontal axis.
Correct Answer:

Verified
Correct Answer:
Verified
Q14: In the long run, demand-pull inflation:<br>A)increases unemployment.<br>B)decreases
Q23: Which of the following most significantly contributed
Q23: The economy enters the long run once:<br>A)nominal
Q25: Refer to the graph below.The effects of
Q28: In the long-run, any inflation that occurs
Q31: Although the increase in long-run aggregate supply
Q48: Which of the following is not a
Q116: The Laffer Curve suggests that lower tax
Q120: Many economists accept the idea of a
Q121: More inflation is likely to result when