Multiple Choice
The table below shows the full-employment budget surplus as a percentage of GDP over a five-year period. 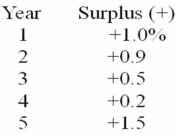
Refer to the above information.In which year was fiscal policy contractionary?
A) Year 2
B) Year 3
C) Year 4
D) Year 5
Correct Answer:

Verified
Correct Answer:
Verified
Q15: A public debt which is owed to
Q39: An expansionary fiscal policy is shown as
Q79: If the economy has a cyclically adjusted
Q83: The crowding-out of investment may be avoided
Q92: The crowding-out effect arises when:<br>A)government borrows in
Q104: Which is regarded as an automatic stabilizer
Q125: <img src="https://d2lvgg3v3hfg70.cloudfront.net/TB2474/.jpg" alt=" -Lines A and
Q125: In an economy, the government wants to
Q129: Refer to the diagram below.Which tax system
Q192: With a regressive tax system, as the