Multiple Choice
Which of the diagrams below best portrays the effects of an increase in consumer spending? 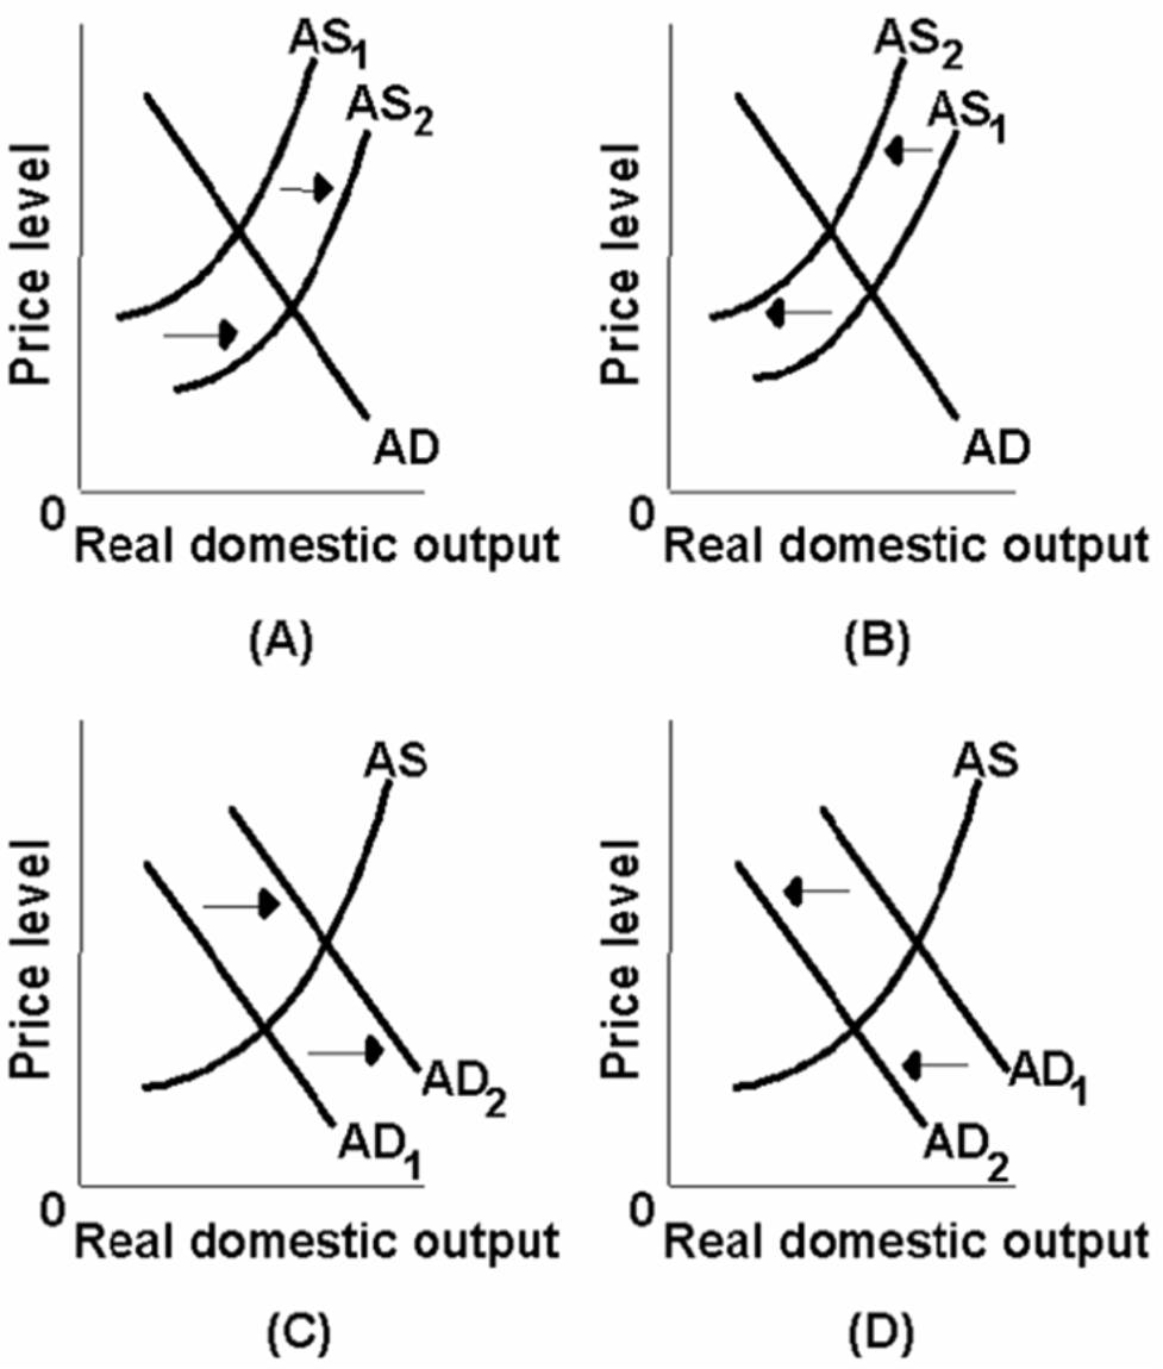
A) A
B) B
C) C
D) D
Correct Answer:

Verified
Correct Answer:
Verified
Related Questions
Q67: <img src="https://d2lvgg3v3hfg70.cloudfront.net/TB2474/.jpg" alt=" -Refer to the
Q68: <img src="https://d2lvgg3v3hfg70.cloudfront.net/TB2474/.jpg" alt=" -Refer to the
Q71: Suppose that real domestic output in an
Q73: Suppose that real domestic output in an
Q74: <img src="https://d2lvgg3v3hfg70.cloudfront.net/TB2474/.jpg" alt=" -Which of the
Q76: Suppose the full-employment level of real output
Q77: In which of the following sets of
Q146: The aggregate demand curve is:<br>A)vertical if full
Q167: An increase in consumer wealth will decrease
Q219: Cost-push inflation is characterized by a(n)<br>A)increase in