Multiple Choice
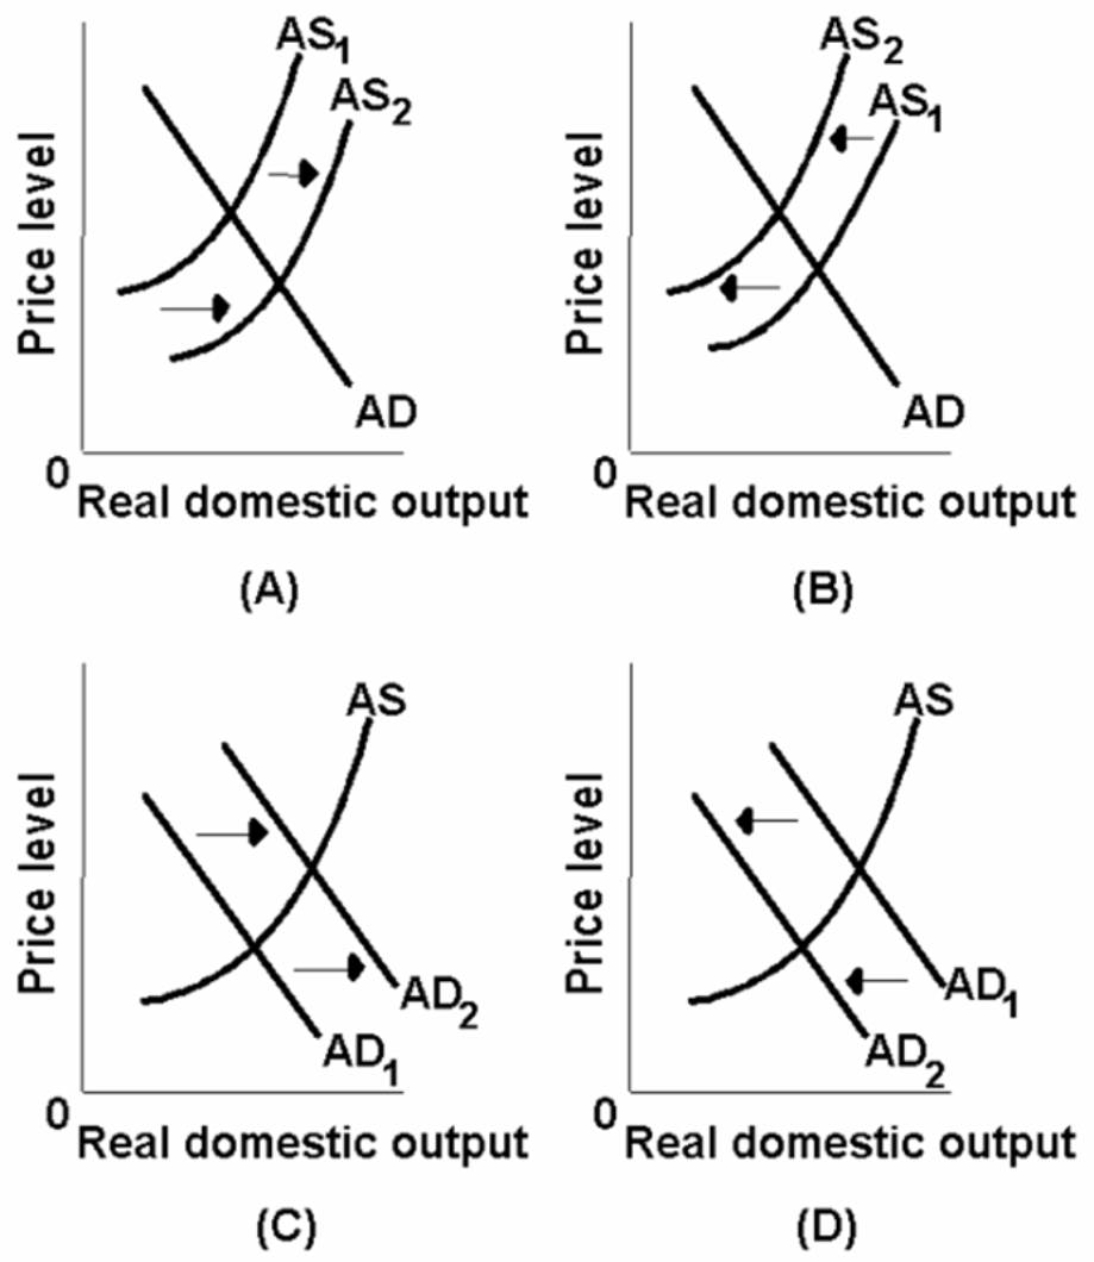
-Which of the above diagrams best portrays the effects of a substantial reduction in government spending?
A) A
B) B
C) C
D) D
Correct Answer:

Verified
Correct Answer:
Verified
Related Questions
Q29: Other things being equal,if world oil prices
Q50: Other things equal, the short-run aggregate supply
Q65: The factors which affect the amounts that
Q67: In terms of aggregate supply, the short
Q78: The interest rate effect indicates that a(n):<br>A)decrease
Q82: In terms of aggregate supply, the difference
Q87: Collective bargaining agreements that prohibit wage cuts
Q95: The interest-rate effect is one of the
Q113: A fall in real interest rates will
Q134: An increase in aggregate demand is most