Multiple Choice
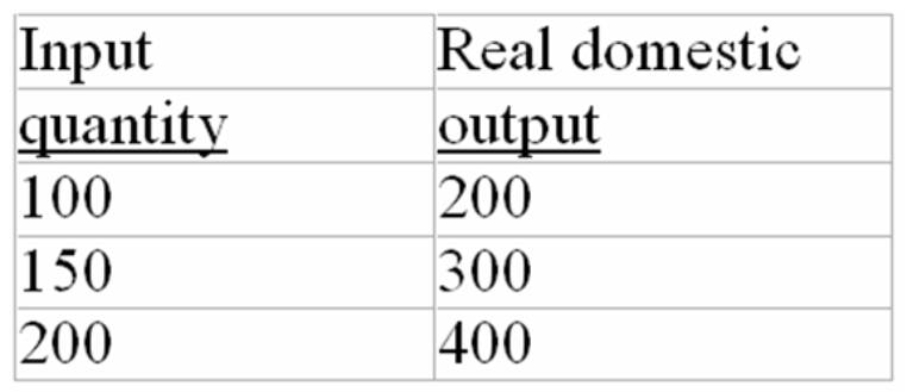
The following table gives information about the relationship between input quantities and real domestic output in a hypothetical economy:

-Suppose that the price of each input increased from $5 to $8.The per unit cost of production in the above economy would:
A) rise by $1.50 and the aggregate supply curve would shift to the right.
B) rise by 60 percent and the aggregate supply curve would shift to the left.
C) rise by 60 percent and the aggregate demand curve would shift to the left.
D) fall by $1.50 and the aggregate demand curve would shift to the right.
Correct Answer:

Verified
Correct Answer:
Verified
Q1: Differentiate between "demand-pull" and "cost-push" inflation using
Q7: Suppose an economic advisor to the Prime
Q26: Using the aggregate demand-aggregate supply (short-run) model,
Q70: The interest-rate and real-balances effects are important
Q99: When the excess capacity of business rises,
Q184: An increase in aggregate expenditures resulting from
Q196: <img src="https://d2lvgg3v3hfg70.cloudfront.net/TB2474/.jpg" alt=" -Refer to the
Q200: <img src="https://d2lvgg3v3hfg70.cloudfront.net/TB2474/.jpg" alt=" -Which of the
Q202: Suppose the full-employment level of real output
Q305: The interest-rate effect suggests that<br>A) a decrease