Multiple Choice
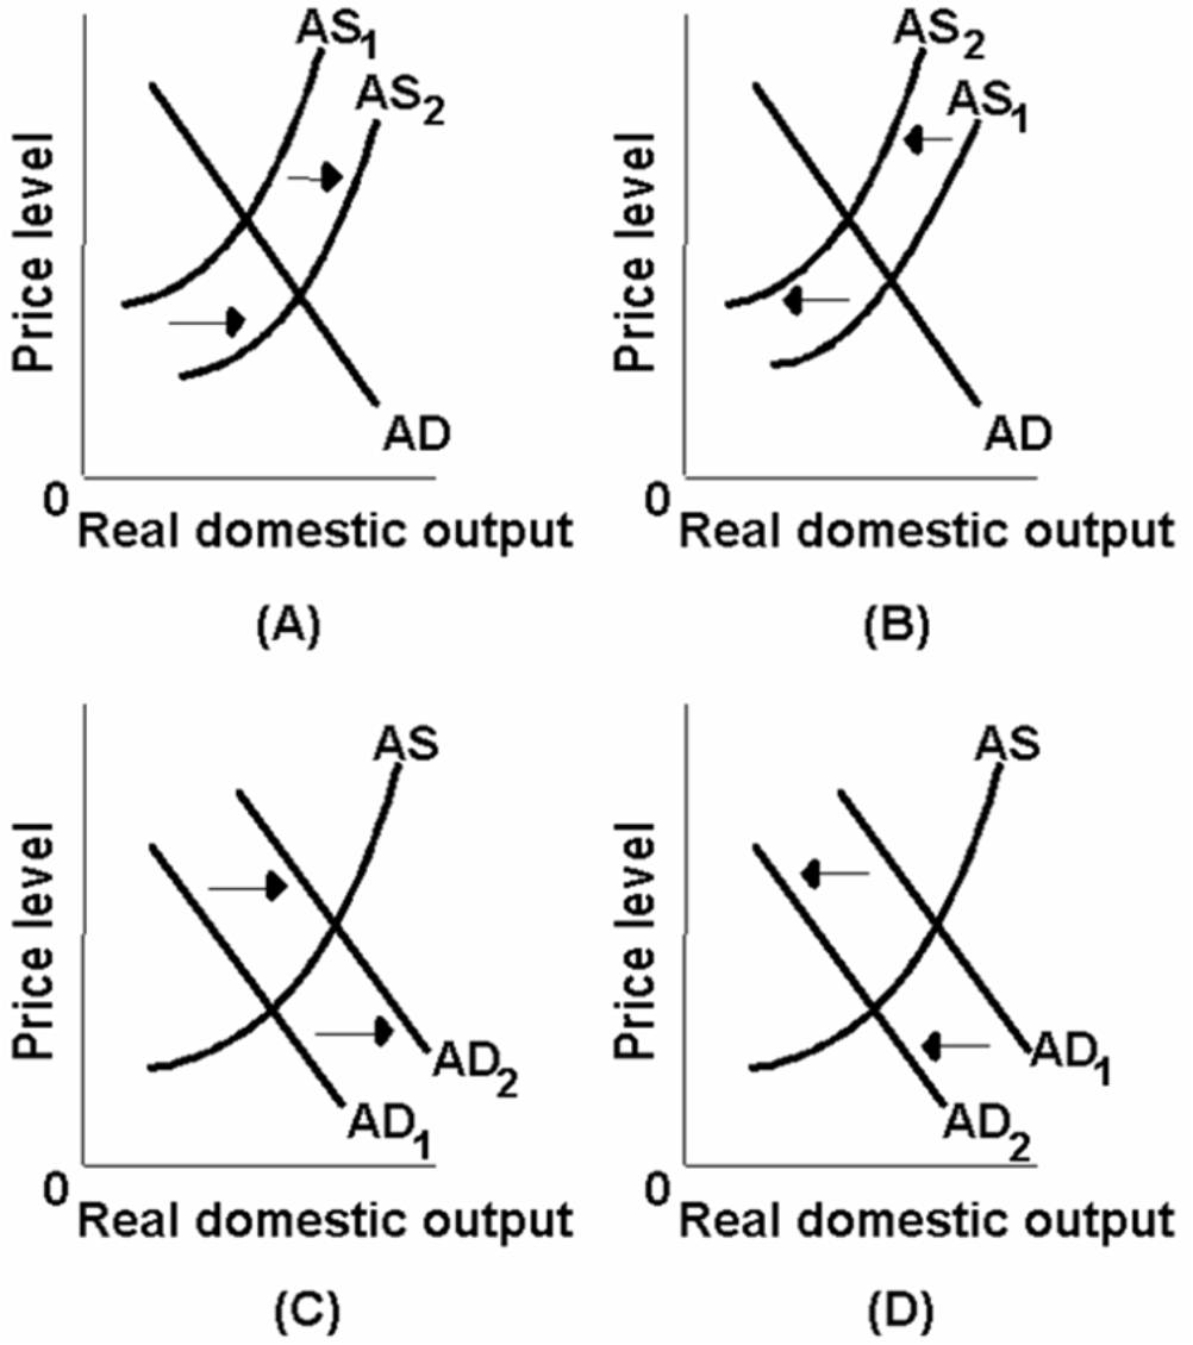
-Which of the above diagrams best portrays the effects of an increase in productivity?
A) A
B) B
C) C
D) D
Correct Answer:

Verified
Correct Answer:
Verified
Related Questions
Q11: What is the aggregate demand curve? What
Q26: An increase in government spending can be
Q95: Other things equal, an increase in productivity
Q129: An increase in taxes will cause a(n):<br>A)decrease
Q212: Refer to the information below.Investment spending would
Q213: Suppose that a hypothetical economy has the
Q214: The aggregate expenditures model and the aggregate
Q215: <img src="https://d2lvgg3v3hfg70.cloudfront.net/TB2474/.jpg" alt=" -Refer to the
Q217: The following table gives information about the
Q218: Which of the factors below best explain