Multiple Choice
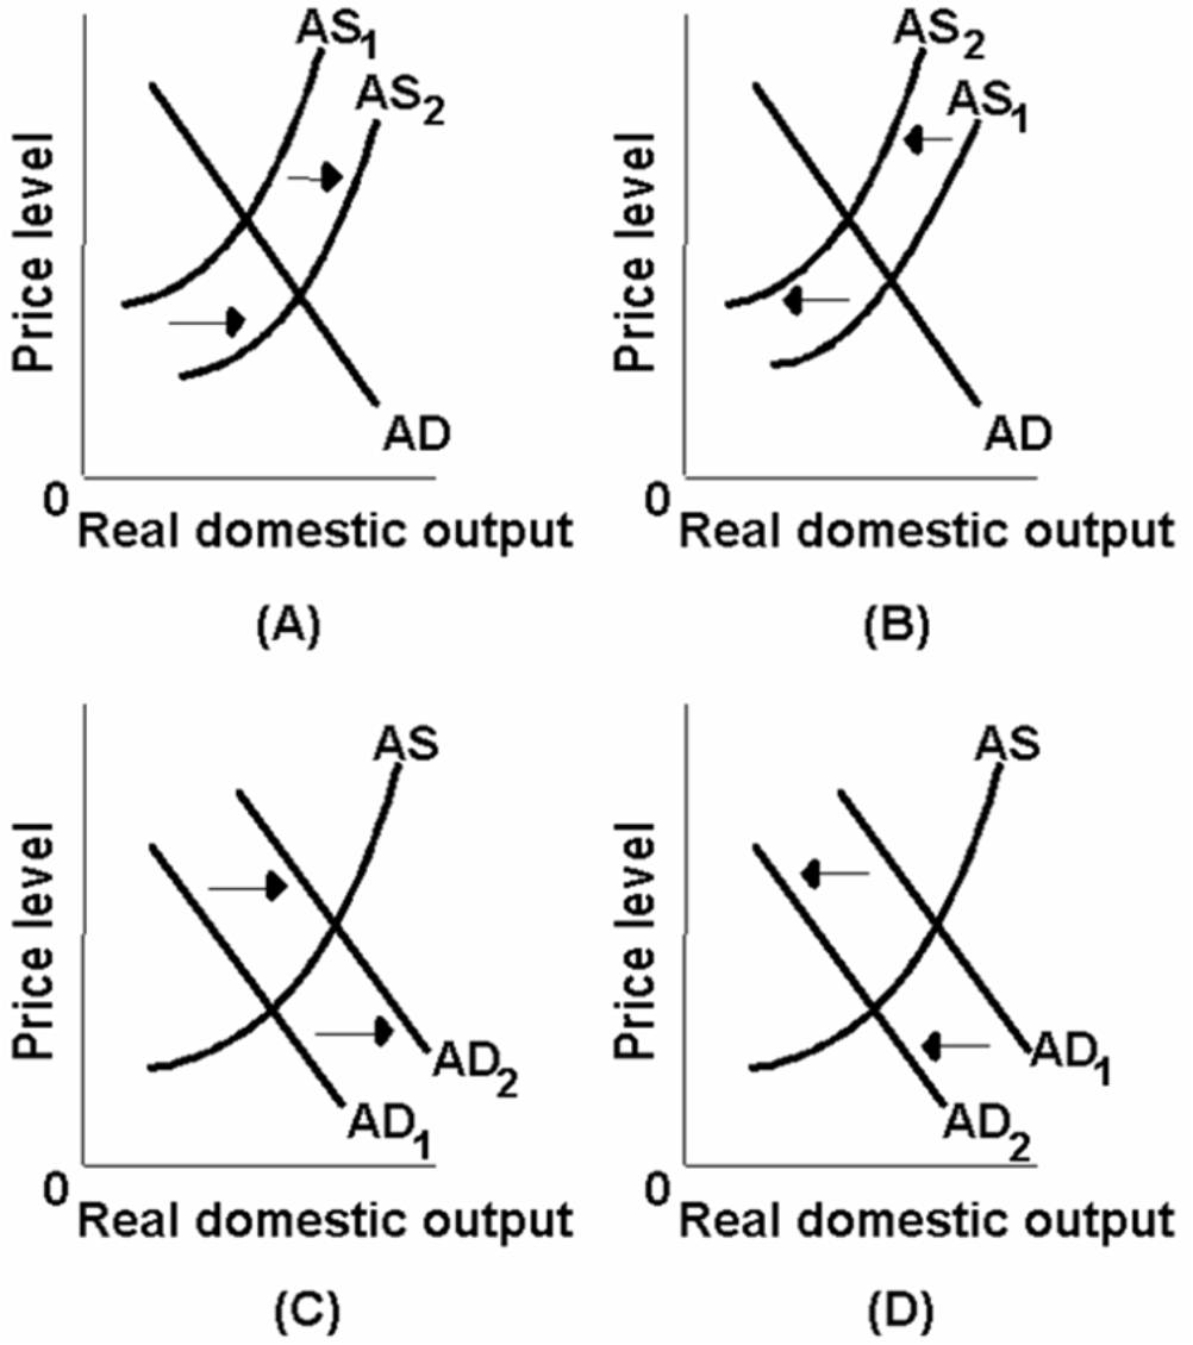
-Which of the above diagrams best portrays the effects of a decrease in the availability of key natural resources?
A) A
B) B
C) C
D) D
Correct Answer:

Verified
Correct Answer:
Verified
Related Questions
Q3: An increase in investment spending caused by
Q9: Why does aggregate demand shift outward by
Q11: What is the aggregate demand curve? What
Q21: How is the long-run aggregate supply curve
Q26: An increase in government spending can be
Q27: The short run aggregate supply curve:<br>A)shows the
Q47: The horizontal shape of the immediate short
Q95: Other things equal, an increase in productivity
Q181: Per-unit production cost is determined by dividing
Q222: In order to study the macroeconomics we