Multiple Choice
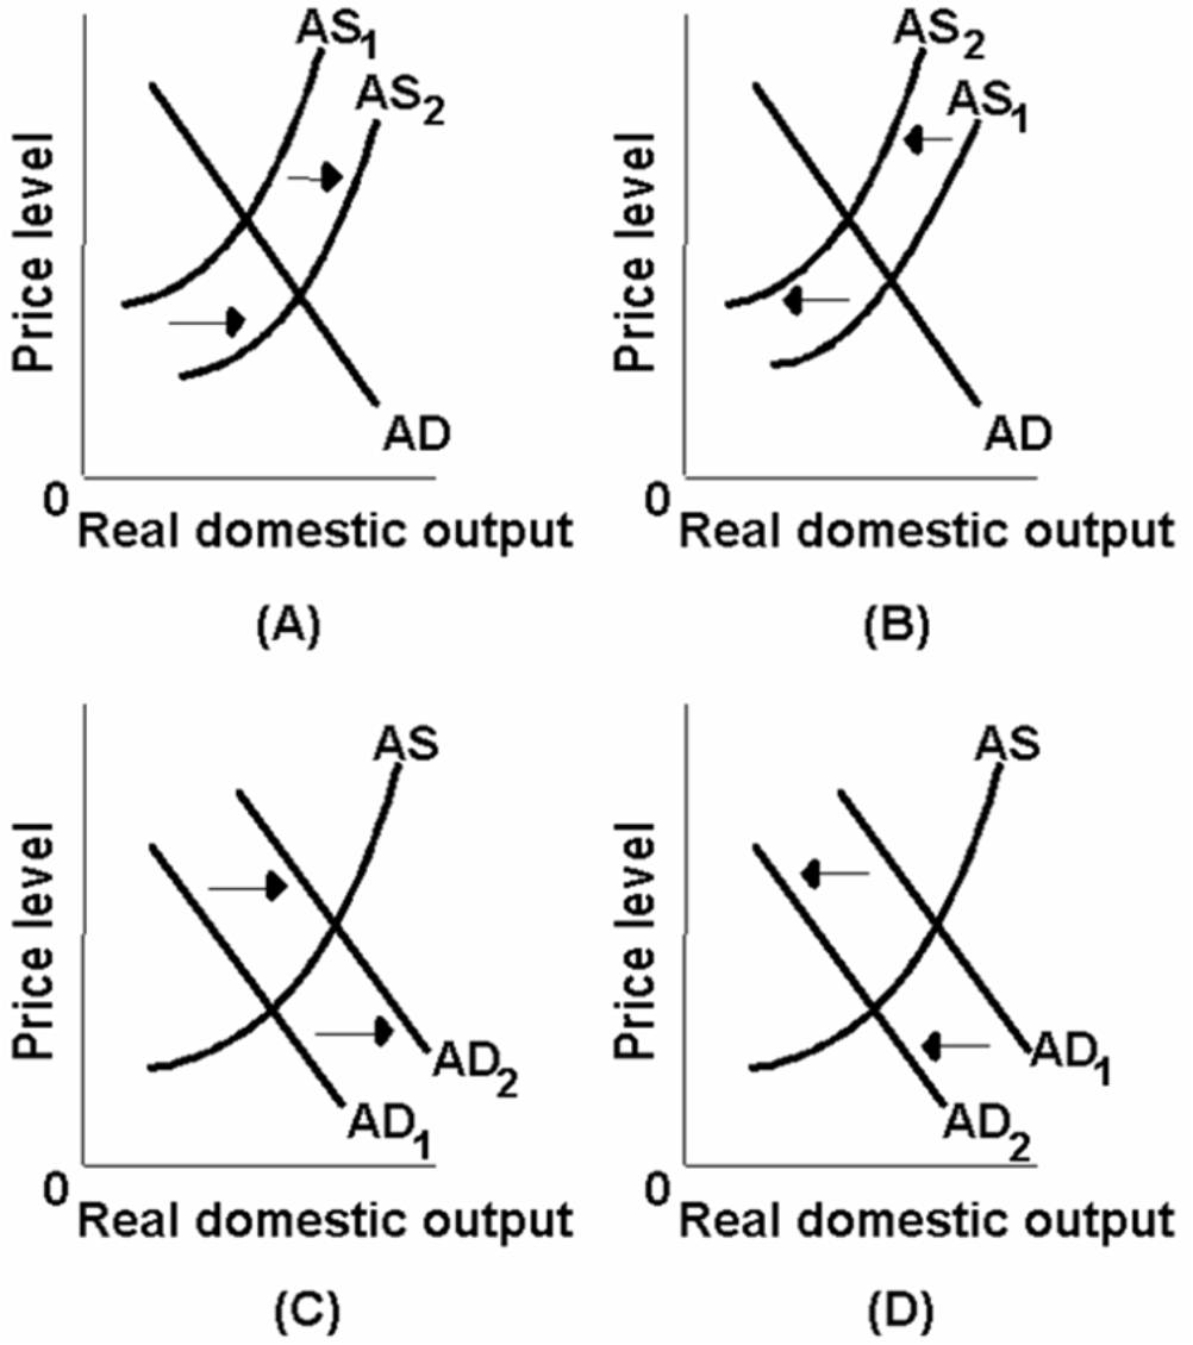
-Which of the above diagrams best portrays the effects of declines in the prices of imported resources?
A) A
B) B
C) C
D) D
Correct Answer:

Verified
Correct Answer:
Verified
Related Questions
Q4: What is the difference in the explanation
Q19: An increase in imports (independently of a
Q22: List the three major determinants that can
Q44: Explain the three reasons given for the
Q76: An increase in investment spending can be
Q91: Suppose higher taxes on businesses cause a
Q115: Suppose that real domestic output in an
Q117: An economy is employing 2 units of
Q120: The following table is for a particular
Q124: We would expect a decline in personal