Multiple Choice
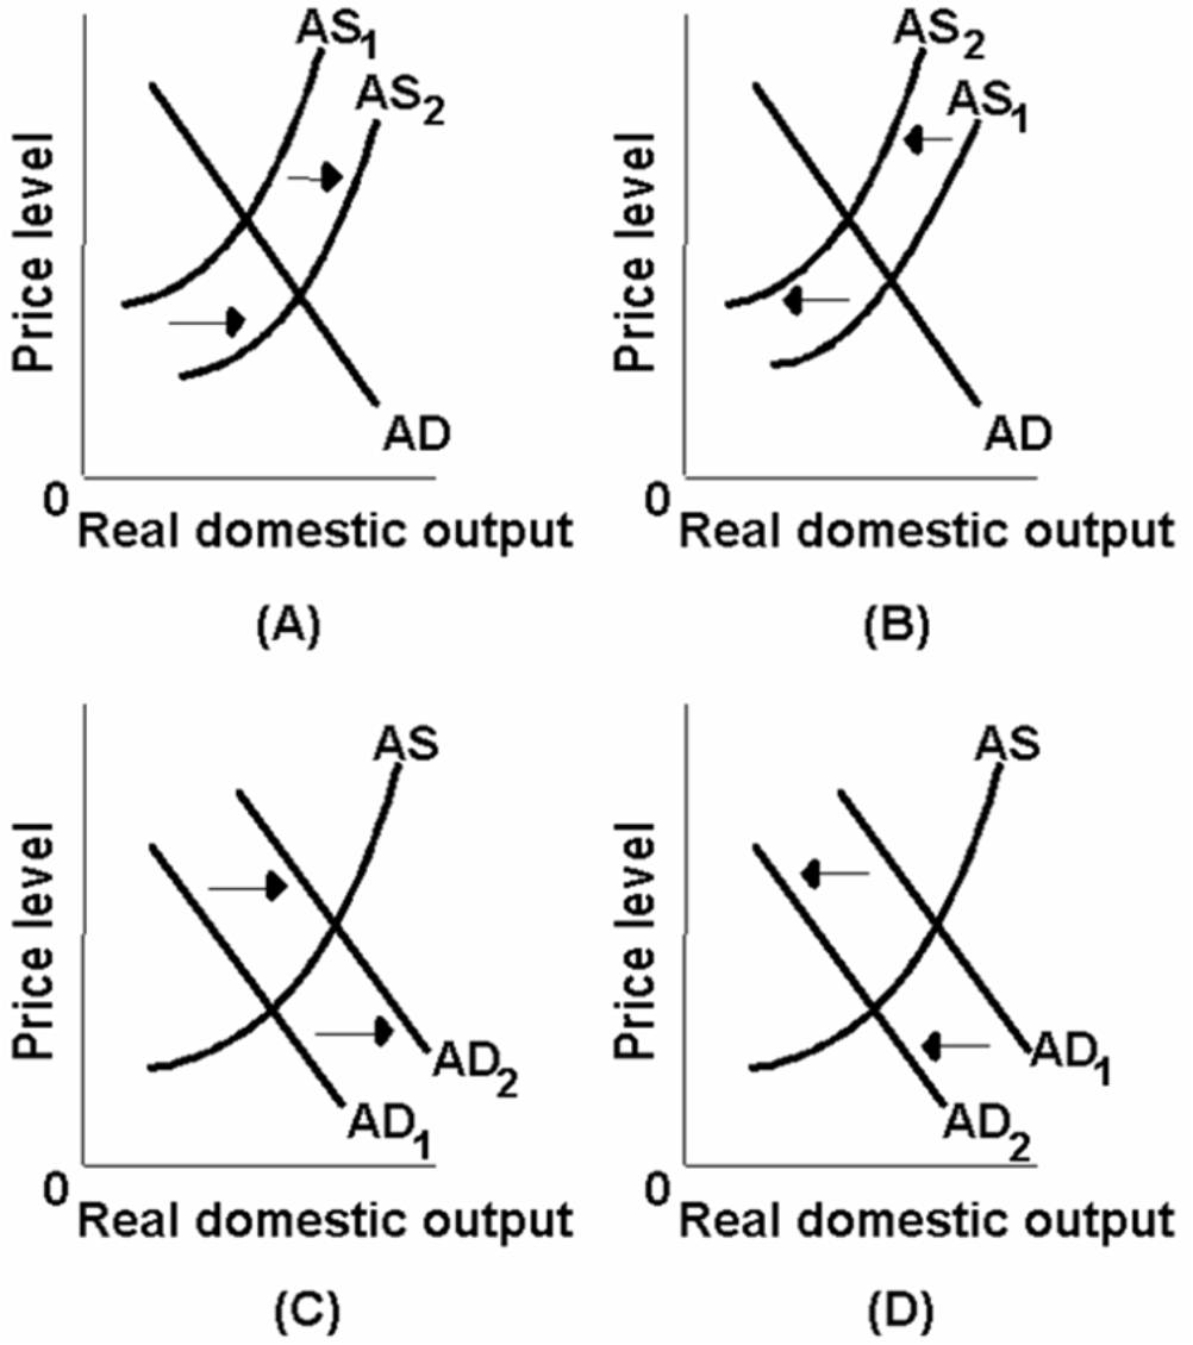
-Which of the above diagrams best portrays the effects of a dramatic increase in energy prices?
A) A
B) B
C) C
D) D
Correct Answer:

Verified
Correct Answer:
Verified
Related Questions
Q13: Wage contracts, efficiency wages, and the minimum
Q51: The relationship between the aggregate demand curve
Q59: Which one of the following would increase
Q80: An increase in the aggregate expenditures schedule<br>A)
Q93: The following aggregate demand and supply schedules
Q97: The following list of items are related
Q99: If real output rises and the price
Q103: The following table shows the aggregate demand
Q152: Which effect best explains the downward slope
Q233: The equilibrium price level and level of