Multiple Choice
The following table shows the aggregate demand and aggregate supply schedule for a hypothetical economy.
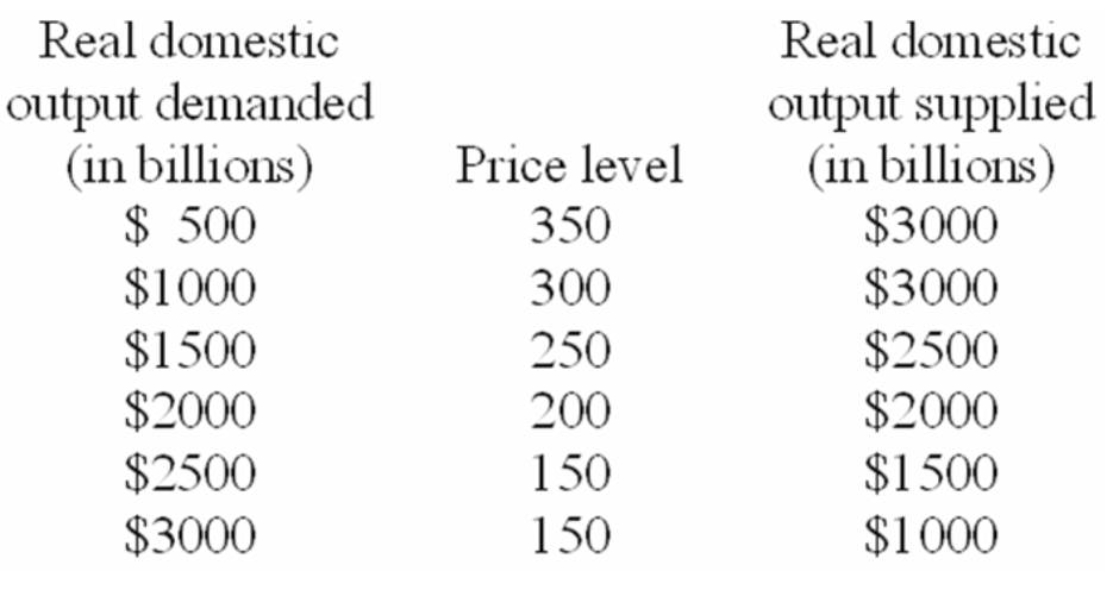
-Refer to the above table.The equilibrium price level and quantity of real domestic output will be:
A) 150 and $1000.
B) 150 and $1500.
C) 200 and $2000.
D) 250 and $2500.
Correct Answer:

Verified
Correct Answer:
Verified
Q26: Using the aggregate demand-aggregate supply (short-run) model,
Q27: Describe the change in short-run aggregate supply
Q89: The aggregate demand curve can be derived
Q112: A rightward shift in the aggregate supply
Q174: Other things equal, an improvement in productivity
Q188: Refer to the table below.If this nation's
Q189: Refer to the above diagram.If the price
Q190: <img src="https://d2lvgg3v3hfg70.cloudfront.net/TB2474/.jpg" alt=" -Refer to the
Q191: Changes in which of the two factors
Q196: <img src="https://d2lvgg3v3hfg70.cloudfront.net/TB2474/.jpg" alt=" -Refer to the