Multiple Choice
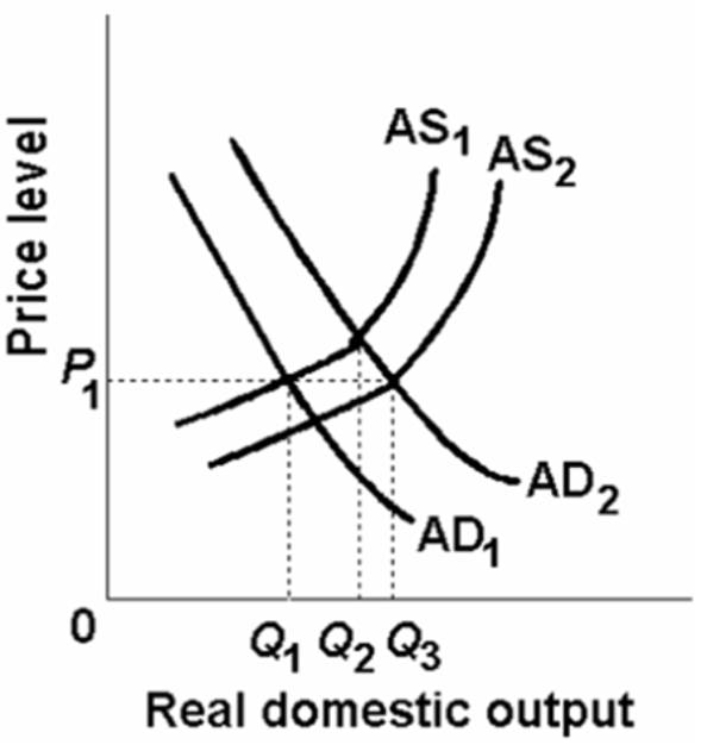
-In the above figure AD1 and AS1 represent the original aggregate supply and demand curves and AD2 and AS2 show the new aggregate demand and supply curves.The change in aggregate supply from AS 1 to AS2 could be caused by:
A) a reduction in the price level.
B) the increased availability of entrepreneurial talent.
C) an increase in business taxes.
D) the real balances,interest-rate,and foreign trade effects.
Correct Answer:

Verified
Correct Answer:
Verified
Q34: How is the short-run aggregate supply curve
Q108: An increase in the price level, other
Q115: A decrease in aggregate demand is most
Q137: Productivity measures<br>A) real output per unit of
Q144: Other things being equal, if the national
Q145: The following table is for a particular
Q148: <img src="https://d2lvgg3v3hfg70.cloudfront.net/TB2474/.jpg" alt=" -In the above
Q157: How can the aggregate demand curve be
Q164: A movement upward along an existing aggregate
Q172: Which would increase aggregate supply?<br>A)an increase in