Essay
In the below diagram assume that the aggregate demand curve shifts from AD1 in year 1 to AD2 in year 2,only to fall back to AD1 in year 3.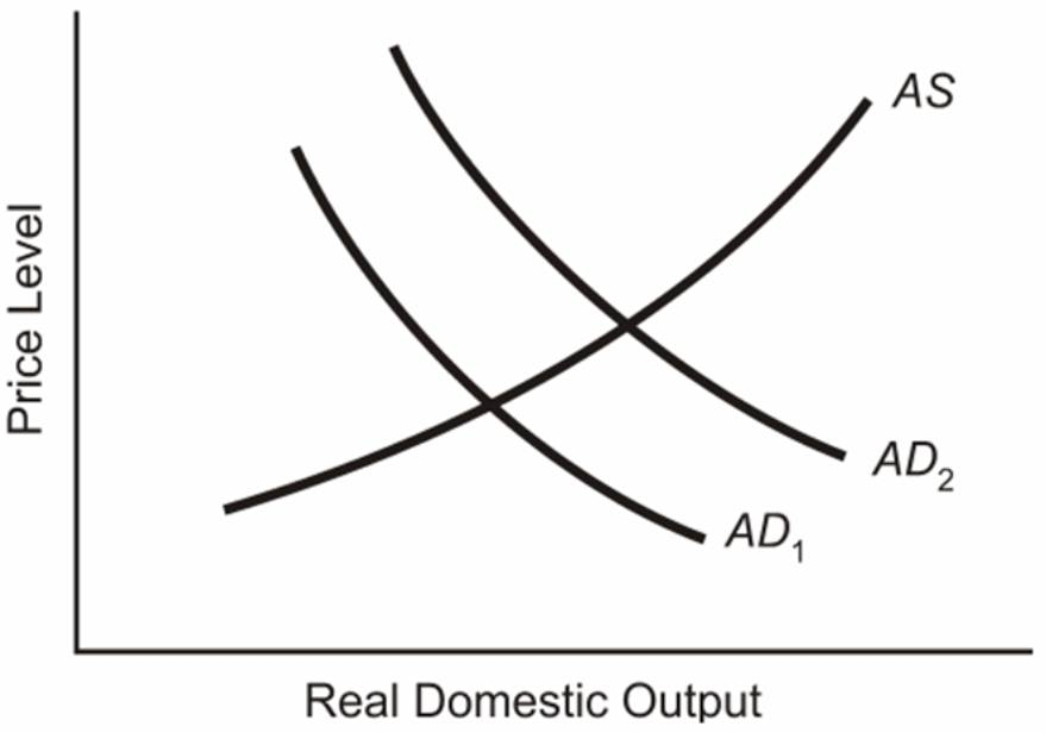
(a)Explain what will happen to the equilibrium price level and the equilibrium level of real GDP from year 1 to year 2.
(b)Locate the new position in year 3 on the assumption that prices and wages are completely flexible downward.Label this position,Pb and GDPb for the price level and real GDP respectively.
(c)Locate the new position in year 3 on the assumption that prices and wages are completely inflexible downward.Label this position,Pc and GDPc for the price level and real GDP respectively.
Correct Answer:

Verified
(a)Equilibrium price and quant...View Answer
Unlock this answer now
Get Access to more Verified Answers free of charge
Correct Answer:
Verified
View Answer
Unlock this answer now
Get Access to more Verified Answers free of charge
Q6: Would increased downward price flexibility lead to
Q32: A movement downward along an existing aggregate
Q40: The passage of new legislation requiring more
Q108: An increase in the price level, other
Q115: A decrease in aggregate demand is most
Q148: <img src="https://d2lvgg3v3hfg70.cloudfront.net/TB2474/.jpg" alt=" -In the above
Q150: Menu costs will:<br>A)increase the amount of training
Q154: The following list of items are related
Q157: How can the aggregate demand curve be
Q164: A movement upward along an existing aggregate