Multiple Choice
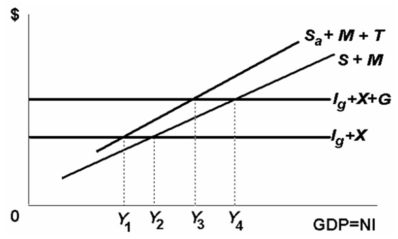
-Refer to the above diagram where Ig is gross investment,X is exports,G is government purchases,S and Sa are saving before and after taxes respectively,M is imports,and T is net taxes,that is,taxes less transfers.The equilibrium level of GDP for this economy is:
A) Y4.
B) Y3.
C) Y2.
D) Y1.
Correct Answer:

Verified
Correct Answer:
Verified
Q18: Other things equal, the multiplier effect associated
Q66: An "inflationary expenditure gap" is the amount
Q71: The table shows the consumption schedule for
Q73: The following information is for a closed
Q74: The following information is consumption and investment
Q75: Refer to the diagram below for a
Q79: The following schedule contains data for a
Q80: <img src="https://d2lvgg3v3hfg70.cloudfront.net/TB2474/.jpg" alt=" -The above diagram
Q114: In the aggregate expenditures model, a reduction
Q174: Exports are added to, and imports are