Multiple Choice
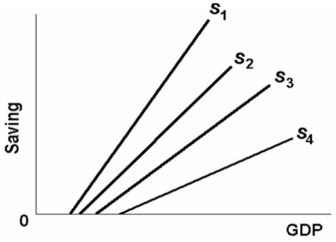
-The above figure shows the saving schedules for economies 1,2,3,and 4.Which economy has the highest marginal propensity to consume?
A) 1
B) 2
C) 3
D) 4
Correct Answer:

Verified
Correct Answer:
Verified
Related Questions
Q7: Dissaving occurs where<br>A) income exceeds consumption.<br>B) saving
Q39: Suppose the government finds it can increase
Q54: The increase in income which results from
Q55: The initial costs of capital goods, and
Q59: Holly's break-even level of income is $10,000
Q100: The 45-degree line on a chart relating
Q109: Which of the following is correct?<br>A) MPC
Q123: Economists disagree on the actual size of
Q153: Assume that for the entire business sector
Q216: If a $200 billion increase in investment