Multiple Choice
Refer to the diagram below.This production possibilities curve is constructed such that: 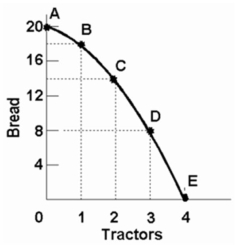
A) resources are presumed to be perfectly shiftable between bread and tractors.
B) the opportunity cost of bread diminishes as more bread is produced.
C) the opportunity cost of tractors diminishes as more bread is produced.
D) the opportunity cost of both bread and tractors in terms of each other increases as more of each is produced.
Correct Answer:

Verified
Correct Answer:
Verified
Q10: Which of the following is a microeconomic
Q47: Which situation would most likely shift the
Q95: The fact that economic generalizations are abstract
Q109: The concept of opportunity cost<br>A) is irrelevant
Q129: When an economy is operating with maximum
Q153: From an economic perspective, when consumers leave
Q224: Production possibilities tables for two countries,North Cantina
Q230: <img src="https://d2lvgg3v3hfg70.cloudfront.net/TB2474/.jpg" alt=" -The linear equation
Q232: Assume that a change in government policy
Q233: (The following economy produces two products. )<br>Production