Multiple Choice
Refer to the diagram below.The concave shape of each production possibilities curve indicates that: 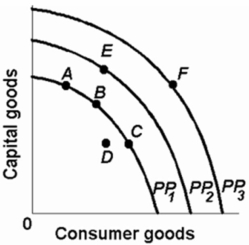
A) resources are perfectly substitutable.
B) wants are virtually unlimited.
C) prices are constant.
D) resources are not equally suited for alternative uses.
Correct Answer:

Verified
Correct Answer:
Verified
Q10: Which of the following is a microeconomic
Q12: Which of the following is associated with
Q56: How is the economic perspective reflected in
Q80: If the equation y = 15 -
Q95: The fact that economic generalizations are abstract
Q101: The price ratio of the two products
Q179: The production possibilities curve tells us:<br>A)what specific
Q221: <img src="https://d2lvgg3v3hfg70.cloudfront.net/TB2474/.jpg" alt=" -Refer to the
Q224: Production possibilities tables for two countries,North Cantina
Q235: The construction of a production possibilities curve