Essay
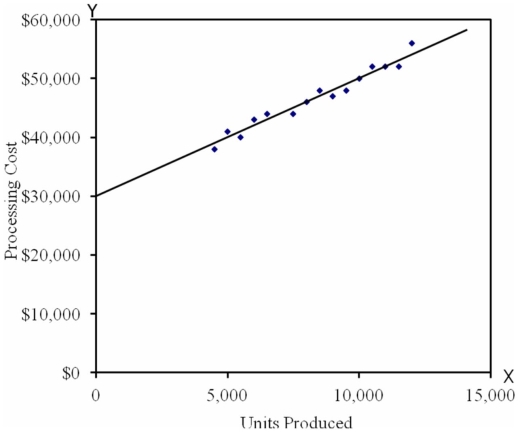
The graph below was produced after recording the processing costs of Oki Products observed over the last 10 months using the following data: 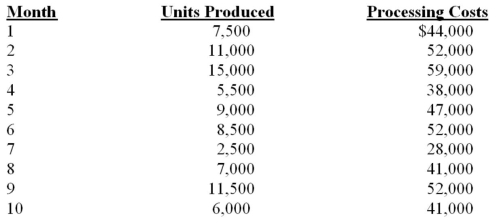
Required:
a.Using the graph identify the monthly fixed costs.What additional information might you determine from the graph?
b.The chart above indicates total processing costs of $47,000 at a level of 9,000 units for month 5.Using this level of activity and your fixed costs determined in a,calculate the variable cost per unit to the nearest cent.Express your results in the form of a linear equation y = a + bx.
c.Use the high low method to determine the variable cost per unit and fixed cost per month.Express your results in the form of a linear equation y = a + bx.
d.Comment on the differences between the results in b and c.Which result would you consider more accurate and why?
Correct Answer:

Verified
a.From the graph it is clear from where ...View Answer
Unlock this answer now
Get Access to more Verified Answers free of charge
Correct Answer:
Verified
View Answer
Unlock this answer now
Get Access to more Verified Answers free of charge
Q54: In the O'Donnell Manufacturing Company, at
Q74: At an activity level of 10,000 units,total
Q75: Contribution margin is the excess of revenues
Q82: Discretionary fixed costs arise from annual decisions
Q84: ABC Company's total overhead costs at various
Q87: The following data pertain to activity and
Q88: Prater Company has provided the
Q91: What is a cost driver?<br>A) It is
Q101: The following information has been provided
Q106: Johnson Company has provided the