True/False
To approximate the width of a class in the creation of a bar chart, we may use this formula: 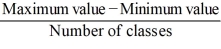
Correct Answer:

Verified
Correct Answer:
Verified
Related Questions
Q61: Thirty students at Eastside High School took
Q62: For quantitative data, a relative frequency distribution
Q63: The following histogram represents the number of
Q64: A frequency distribution for qualitative data groups
Q65: Consider the following stem-and-leaf diagram. <img src="https://d2lvgg3v3hfg70.cloudfront.net/TB6618/.jpg"
Q67: In the accompanying stem-and-leaf diagram, the values
Q68: A statistics instructor computes the grade and
Q69: A bar chart depicts the frequency or
Q70: Thirty students at Eastside High School took
Q71: An analyst constructed the following frequency distribution