Multiple Choice
The following frequency distribution shows the frequency of the asking price, in thousands of dollars, for current homes on the market in a particular city. 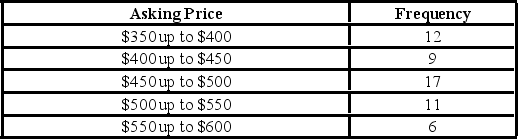 What percentage of houses has an asking price between $350,000 and under $400,000?
A) 16.4%
B) 21.8%
C) 30.9%
D) 33.3%
Correct Answer:

Verified
Correct Answer:
Verified
Q39: In the accompanying stem-and-leaf diagram, the values
Q40: The Statistical Abstract of the United States
Q41: The following stem-and-leaf diagram shows the last
Q42: A bar chart may be displayed horizontally.
Q43: A stem-and-leaf diagram is constructed by separating
Q45: Consider the following frequency distribution. <img src="https://d2lvgg3v3hfg70.cloudfront.net/TB6618/.jpg"
Q46: An analyst constructed the following frequency distribution
Q47: Consider the following frequency distribution. <img src="https://d2lvgg3v3hfg70.cloudfront.net/TB6618/.jpg"
Q48: The manager at a water park constructed
Q49: The following histogram represents the number of