Multiple Choice
The following frequency distribution shows the frequency of the asking price, in thousands of dollars, for current homes on the market in a particular city. 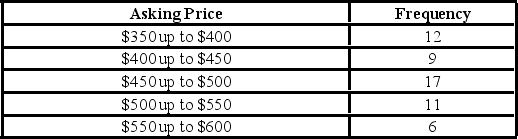 What percentage of houses has an asking price under $550,000?
A) 50.5%
B) 69.1%
C) 89.1%
D) 95.0%
Correct Answer:

Verified
Correct Answer:
Verified
Q93: Students in Professor Smith's business statistics course
Q94: A histogram is a series of rectangles
Q95: When using a polygon to graph quantitative
Q96: The following data represent the recent sales
Q97: When constructing a frequency distribution for quantitative
Q99: Students in Professor Smith's business statistics course
Q100: A scatterplot depicts a positive _ relationship,
Q101: In the accompanying stem-and-leaf diagram, the values
Q102: What type of relationship is indicated in
Q103: Consider the following frequency distribution. <img src="https://d2lvgg3v3hfg70.cloudfront.net/TB6618/.jpg"