Essay
A survey of 400 unemployed people was completed at a job fair. Each person was asked to categorize his or her job interests. The accompanying relative frequency distribution was constructed. 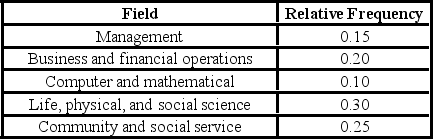 a. Construct the corresponding frequency distribution. How many of these people designated that the computer and mathematical industry was their job interest?
B) Construct a pie chart.
Correct Answer:

Verified
a. See the table below for the...View Answer
Unlock this answer now
Get Access to more Verified Answers free of charge
Correct Answer:
Verified
View Answer
Unlock this answer now
Get Access to more Verified Answers free of charge
Q69: A bar chart depicts the frequency or
Q70: Thirty students at Eastside High School took
Q71: An analyst constructed the following frequency distribution
Q72: Johnson and Johnson (JNJ) is a consumer
Q73: Horizontal bar charts are constructed by placing
Q75: A stem-and-leaf diagram is useful in that
Q76: For which of the following data sets
Q77: The following data represent scores on a
Q78: A stem-and-leaf diagram most resembles a(n) _.<br>
Q79: An ogive is a graph that plots