Essay
The following are the measures based on independently drawn samples from normally distributed populations. 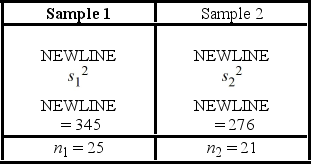 a. Construct a 90% interval estimate of the ratio of the population variances.
B) Test if the ratio of the population variances differs from Sample 1, using the computed confidence interval, at the 10% significance level.
Correct Answer:

Verified
a. [0.60, 2.54]
b. R...View Answer
Unlock this answer now
Get Access to more Verified Answers free of charge
Correct Answer:
Verified
b. R...
View Answer
Unlock this answer now
Get Access to more Verified Answers free of charge
Q86: A researcher compares the returns for two
Q87: Annual growth rates for individual firms in
Q88: The following table shows the annual returns
Q89: Use the F table to approximate these
Q90: If a sample of size n is
Q92: The <img src="https://d2lvgg3v3hfg70.cloudfront.net/TB6618/.jpg" alt="The distribution
Q93: The result of placing a larger sample
Q94: Consider the expected returns (in percent) from
Q95: The null hypothesis H<sub>0</sub>: σ<sup>2</sup> ≤ <img
Q96: The sales price (in $1,000) of three-bedroom