Essay
Use the p-value approach to conduct the following left-tailed hypothesis test at the 10% significance level. Use the following results from two independently drawn samples from normally distributed populations: Η0:  /
/  ≥ 1, ΗA:
  /
/  < 1.
< 1. 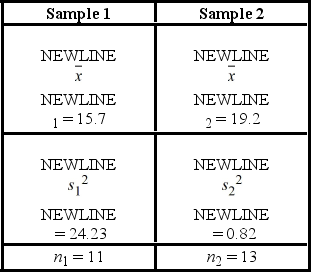
Correct Answer:

Verified
The test statistic is 29.55 an...View Answer
Unlock this answer now
Get Access to more Verified Answers free of charge
Correct Answer:
Verified
View Answer
Unlock this answer now
Get Access to more Verified Answers free of charge
Q72: Consider the following hypotheses: H<sub>0</sub>: σ<sup>2</sup> =
Q73: The following are the competing hypotheses and
Q74: The administrator of a college is concerned
Q75: Consider the expected returns (in percent) from
Q76: A right-tailed test for the ratio of
Q78: The Excel's function _ returns the p-value
Q79: How does the width of the interval
Q80: Use the R function _ to obtain
Q81: Which of the following hypotheses is a
Q82: Consider the expected returns (in percent) from