Multiple Choice
The following frequency distribution shows the monthly stock returns for Home Depot for the years 2003 through 2007. 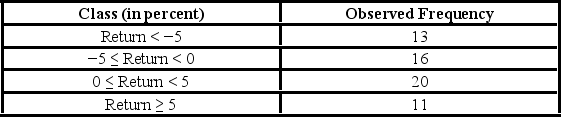 Over the time period, the following summary statistics are provided: Mean = 0.31%, Standard deviation = 6.49%, Skewness = 0.15, and Kurtosis = 0.38. The expected frequency for the class 0 ≤ Return < 5 if the return is normally distributed is ________.
A) 12.37
B) 16.44
C) 17.05
D) 14.15
Correct Answer:

Verified
Correct Answer:
Verified
Q8: In the following table, individuals are cross-classified
Q9: Suppose Bank of America would like to
Q10: The airline industry defines "no-shows" as passengers
Q11: Suppose Bank of America would like to
Q12: For the goodness-of-fit test, the sum of
Q14: A university has six colleges and takes
Q15: In the following table, likely voters' preferences
Q16: A university has six colleges and takes
Q17: In the following table, individuals are cross-classified
Q18: The heights (in cm) for a random