Multiple Choice
The following frequency distribution shows the monthly stock returns for Home Depot for the years 2003 through 2007. 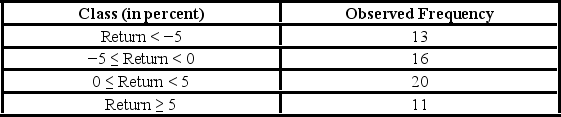 Over the time period, the following summary statistics are provided: Mean = 0.31%, Standard deviation = 6.49%, Skewness = 0.15, and Kurtosis = 0.38. At the 5% confidence level, which of the following is the correct conclusion for this goodness-of-fit test for normality?
A) Reject the null hypothesis; conclude that monthly stock returns are normally distributed with mean 0.31% and standard deviation 6.49%.
B) Reject the null hypothesis; conclude that monthly stock returns are not normally distributed with mean 0.31% and standard deviation 6.49%.
C) Do not reject the null hypothesis; conclude that monthly stock returns are normally distributed with mean 0.31% and standard deviation 6.49%
D) Do not reject the null hypothesis; conclude that monthly stock returns are not normally distributed with mean 0.31% and standard deviation 6.49%.
Correct Answer:

Verified
Correct Answer:
Verified
Q20: The heights (in cm) for a random
Q21: In the following table, individuals are cross-classified
Q22: A university has six colleges and takes
Q23: Suppose you want to determine if the
Q24: The heights (in cm) for a random
Q26: A card-dealing machine deals spades (1), hearts
Q27: A fund manager wants to know if
Q28: The chi-square test of a contingency table
Q29: The following frequency distribution shows the monthly
Q30: A fund manager wants to know if