Essay
The following table shows the observed frequencies of the quarterly returns for a sample of 60 hedge funds. The table also contains the hypothesized proportions of each class assuming the quarterly returns have a normal distribution. The sample mean and standard deviation are 3.6% and 7.4% respectively. 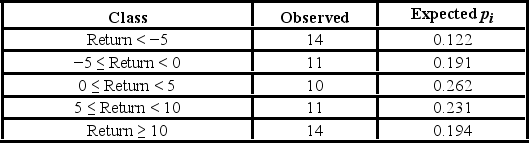 a. Set up the competing hypotheses for the goodness-of-fit test of normality for the quarterly returns.
B) Calculate the value of the test statistic and determine the degrees of freedom.
C) Compute the p-value. Does the evidence suggest that the quarterly returns do not have a normal distribution at the 10% significance level?
Correct Answer:

Verified
a. H0: Quarterly returns follow a normal ...View Answer
Unlock this answer now
Get Access to more Verified Answers free of charge
Correct Answer:
Verified
View Answer
Unlock this answer now
Get Access to more Verified Answers free of charge
Q84: If the null hypothesis is rejected by
Q85: The heights (in cm) for a random
Q86: The following table shows the distribution of
Q87: The calculation of the Jarque-Bera test statistic
Q88: A fund manager wants to know if
Q90: A manufacturer of flash drives for data
Q91: A university has six colleges and takes
Q92: For the goodness-of-fit test, the expected category
Q93: A researcher wants to verify his belief
Q94: The following table shows the distribution of