Multiple Choice
A marketing analyst wants to examine the relationship between sales (in $1,000s) and advertising (in $100s) for firms in the food and beverage industry and collects monthly data for 25 firms. He estimates the model: Sales = β0 +β1 Advertising + ε. The following ANOVA table shows a portion of the regression results. 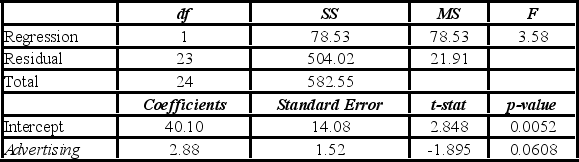 Which of the following is true?
A) If Advertising goes up by $100, then we predict Sales to go up by $2,880.
B) If Sales go up by $100, then we predict Advertising to go up by $2,880.
C) If Advertising goes up by $100, then we predict Sales to go up by $4,298.
D) If Sales go up by $100, then we predict Advertising to go up by $4,298.
Correct Answer:

Verified
Correct Answer:
Verified
Q117: The value 0.75 of a sample correlation
Q118: The following scatterplot indicates that the relationship
Q119: The sample standard deviations for x and
Q120: The variance of the rates of return
Q121: The following scatterplot indicates that the relationship
Q123: A manager at a ski resort in
Q124: A multiple regression model with four explanatory
Q125: If two linear regression models have the
Q126: The covariance can be used to determine
Q127: The following table shows the number of