Multiple Choice
A sociologist examines the relationship between the poverty rate and several socioeconomic factors. For the 50 states and the District of Columbia (n = 51) , he collects data on the poverty rate (y, in %) , the percent of the population with at least a high school education (x1) , median income (x2, in $1000s) , and the mortality rate per 1,000 residents (x3) . He estimates the following model as = β0 + β1Education + β2Income + β3Mortality + ε. The following ANOVA table shows a portion of the regression results. 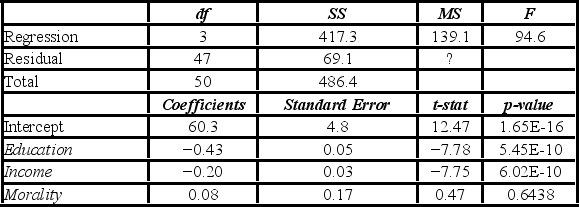 What is the poverty rate for a state where 85% of the population has at least a high school education, the median income is $50,000, and the mortality rate is 10 per 1,000 residents?
A) 12.6%
B) 14.6%
C) 16.6%
D) 18.6%
Correct Answer:

Verified
Correct Answer:
Verified
Q54: The following table shows the number of
Q55: The following data for five years of
Q56: The _ regression model allows for multiple
Q57: Consider the following simple linear regression model:
Q58: Consider the following data: <img src="https://d2lvgg3v3hfg70.cloudfront.net/TB6618/.jpg" alt="Consider
Q60: Consider the following sample data: <img src="https://d2lvgg3v3hfg70.cloudfront.net/TB6618/.jpg"
Q61: Which of the following statements is the
Q62: _ correlation can make two variables appear
Q63: Which of the following Excel functions returns
Q64: A marketing analyst wants to examine the