Multiple Choice
Typically, the sales volume declines with an increase of a product price. It has been observed, however, that for some luxury goods the sales volume may increase when the price increases. The following scatterplot illustrates this rather unusual relationship. 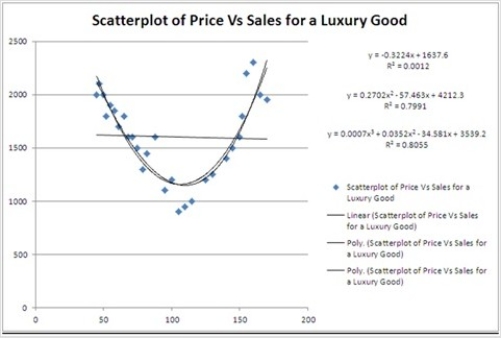 For the considered range of the price, the relationship between Price and Sales should be described by a ________.
A) concave function
B) hyperbola
C) convex function
D) linear function
Correct Answer:

Verified
Correct Answer:
Verified
Q5: The scatterplot shown below represents a typical
Q6: The curve representing the regression equation <img
Q7: Typically, the sales volume declines with an
Q8: The fit of the regression equations <img
Q9: For the exponential model ln(y) = β<sub>0</sub>
Q11: For the quadratic equation <img src="https://d2lvgg3v3hfg70.cloudfront.net/TB6618/.jpg" alt="For
Q12: The logarithmic and log-log models, y =
Q13: Although allowing for nonlinear trends, polynomials are
Q14: Which of the following regression models is
Q15: What R function is used to fit