Multiple Choice
The following data, with the corresponding Excel scatterplot, show the average growth rate of Weeping Higan cherry trees planted in Washington, DC. At the time of planting, the trees were one year old and were all six feet in height. 
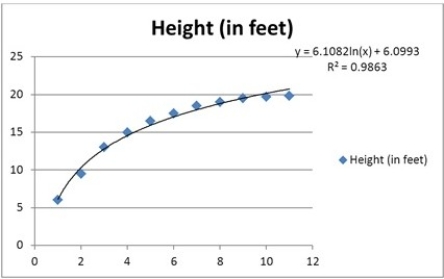 What is the regression model used to describe the relationship between Height and Age?
A) Exponential model
B) Logarithmic model
C) Linear model
D) Log-log model
Correct Answer:

Verified
Correct Answer:
Verified
Q72: The following data show the cooling temperatures
Q73: The following scatterplot shows productivity and number
Q74: The following data, with the corresponding Excel
Q75: Which of the following regression models is
Q76: The log-log regression model is _ in
Q78: Which of the following regression models is
Q79: The log-log and the _ models can
Q80: It is believed that the sales volume
Q81: The following data show the demand for
Q82: Which of the following is a typical