Short Answer
It is believed that the sales volume of one-liter Pepsi bottles depends on the price of the bottle and the price of a one-liter bottle of Coca-Cola. The following data have been collected for a certain sales region. 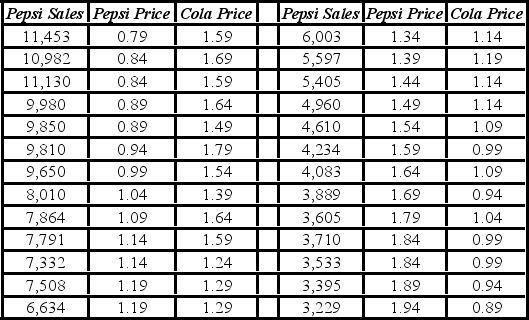 The linear model Pepsi Sales = β0 + β1Pepsi Price + β2Cola Price + ε and the log-log model ln(Pepsi Sales) = β0 + β1ln(Pepsi Price) + β2ln(Cola Price) + ε have been estimated as follows:
 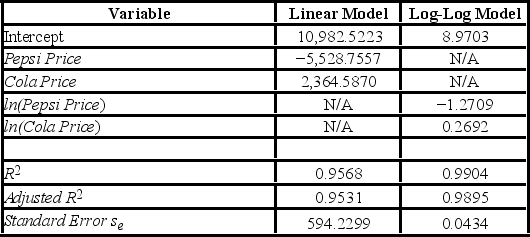 Using Excel or R,what is the percentage of variations in the Pepsi Sales as explained by the log-log model?
Correct Answer:

Verified
Correct Answer:
Verified
Q45: In which of the following models does
Q46: Which of the following is not a
Q47: For a quadratic regression model , it
Q48: Which of the following regression models is
Q49: Typically, the sales volume declines with an
Q51: For the quadratic regression equation <img src="https://d2lvgg3v3hfg70.cloudfront.net/TB6618/.jpg"
Q52: Typically, the sales volume declines with an
Q53: In which of the following models does
Q54: To compute the coefficient of determination R<sup>2</sup>
Q55: It is believed that the sales volume