Multiple Choice
According to the Center for Disease Control and Prevention, life expectancy at age 65 in America is about 18.7 years. Medical researchers have argued that while excessive drinking is detrimental to health, drinking a little alcohol every day, especially wine, may be associated with an increase in life expectancy. Others have also linked longevity with income and gender. The data relating to the length of life after 65 (Life) were collected. Data also include: average income (in $1,000s) (Income) , the average number of alcoholic drinks consumed per day (Drinks) , and a dummy variable Woman. The following model was created: Life = β0 + β1Income + β2Drinks + β3Woman + ε. The Excel partial output corresponding to this model is shown below. 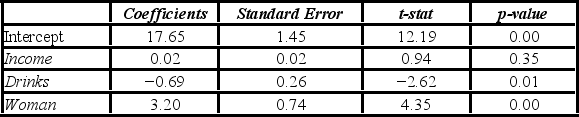 Which of the following is the estimated regression equation for the life expectancy?
A)  = 17.65 + 0.02Income - 0.69Drinks + 3.20Woman
B)  = 20.85 + 0.02Income - 0.69Drinks
C)  = 12.19 + 0.94Income - 2.62Drinks + 4.35Woman
D)  = 16.54 + 0.94Income - 2.62Drinks
Correct Answer:

Verified
Correct Answer:
Verified
Q47: For the model y = β<sub>0 </sub>+
Q48: A bank manager is interested in assigning
Q49: A bank manager is interested in assigning
Q50: Including as many dummy variables as there
Q51: The number of dummy variables representing a
Q53: A realtor wants to predict and compare
Q54: According to the Center for Disease Control
Q55: Consider the following regression model: Humidity =
Q56: Consider the regression model y = β<sub>0
Q57: An over-the-counter drug manufacturer wants to examine