Multiple Choice
The following table shows the annual revenues (in millions of dollars) of a pharmaceutical company over the period 1990-2011. 
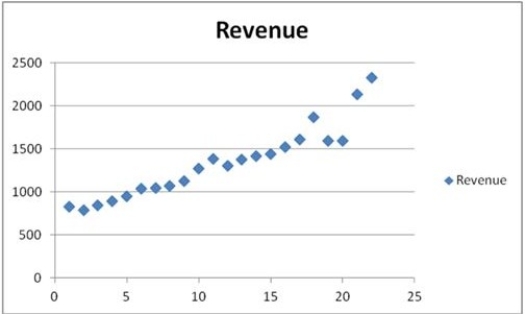 The scatterplot indicates that the annual revenues have an increasing trend. Linear, exponential, quadratic, and cubic models were fit to the data starting with t = 1, and the following output was generated.
  Which of the following is a linear trend equation?
A)  t = 642.7t + 60.496
B)  t = 642.7 + 60.496t
C)  t = 642.7 + 60.496t2 D) yt = 642.7 + 60.496t + ε
Correct Answer:

Verified
Correct Answer:
Verified
Q87: Smoothing techniques are suitable for use when
Q88: The following table includes the information about
Q89: With the method of seasonal dummy variables,
Q90: Quantitative forecasting procedures are based on the
Q91: The following table shows the annual revenues
Q93: When a time series is analyzed by
Q94: If there are T observations to estimate
Q95: A seasonal component differs from a cyclical
Q96: Which of the following is not true
Q97: In the decomposition method, which of the