Multiple Choice
The following table shows the annual revenues (in millions of dollars) of a pharmaceutical company over the period 1990-2011. 
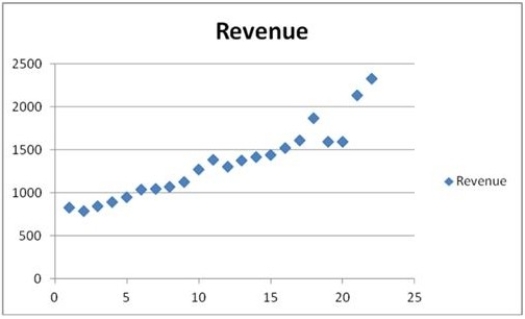 The scatterplot indicates that the annual revenues have an increasing trend. Linear, exponential, quadratic, and cubic models were fit to the data starting with t = 1, and the following output was generated.
  Which of the following is the revenue forecast for 2012 found by the linear trend equation?
A) About 2 billion 149 million dollars
B) About 2 billion and 189 million dollars
C) About 2 billion and 334 million dollars
D) About 2 billion and 34 million dollars
Correct Answer:

Verified
Correct Answer:
Verified
Q115: Which of the following is a centered
Q116: The following table includes the information about
Q117: A time series with observed long-term upward
Q118: In the time series decomposition method, to
Q119: The following table includes the information about
Q121: Prices of crude oil have been steadily
Q122: Which of the following is a similarity
Q123: A linear trend can be estimated using
Q124: Quarterly sales of a department store for
Q125: If the model y<sub>t</sub> = T<sub>t</sub> ×