Multiple Choice
The following table shows the annual revenues (in millions of dollars) of a pharmaceutical company over the period 1990-2011. 
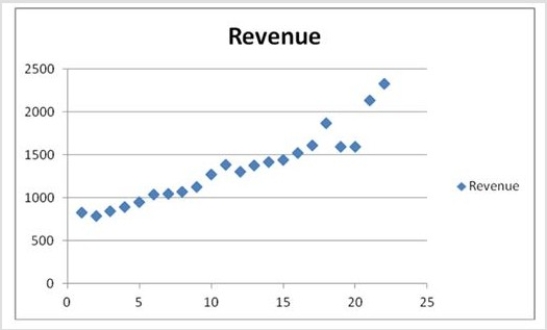 The scatterplot indicates that the annual revenues have an increasing trend. Linear, exponential, quadratic, and cubic models were fit to the data starting with t = 1, and the following output was generated.
  Which of the following is an exponential trend equation?
A)  t = exp(6.632 + 0.045t + (0.069) 2⁄2)
B)  t = 6.632 + 0.045t + 0.069 ⁄ 2
C)  t = exp(6.632 + 0.045t + 0.069 ⁄ 2)
D)  t = 6.632 + 0.045t + (0.069) 2⁄2
Correct Answer:

Verified
Correct Answer:
Verified
Q5: When the model y<sub>t</sub> = T<sub>t</sub> ×
Q6: The past monthly demands are shown below.
Q7: Given the estimated model <img src="https://d2lvgg3v3hfg70.cloudfront.net/TB6618/.jpg" alt="Given
Q8: The following table shows the annual revenues
Q9: _ patterns are caused by the presence
Q11: The linear trend model, <img src="https://d2lvgg3v3hfg70.cloudfront.net/TB6618/.jpg" alt="The
Q12: When a time series is analyzed by
Q13: When comparing which of the following trend
Q14: When the exponential trend model is used
Q15: When comparing polynomial trend models, we use