Multiple Choice
The following table shows the annual revenues (in millions of dollars) of a pharmaceutical company over the period 1990-2011. 
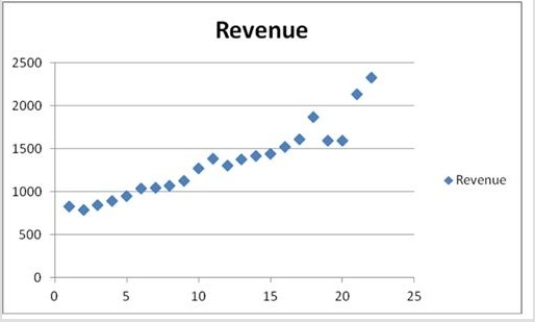 The scatterplot indicates that the annual revenues have an increasing trend. Linear, exponential, quadratic, and cubic models were fit to the data starting with t = 1, and the following output was generated.
  When three polynomial trend equations are compared, which of them provides the best fit?
A) Linear
B) Exponential
C) Quadratic
D) Cubic
Correct Answer:

Verified
Correct Answer:
Verified
Q39: The following table shows the annual revenues
Q40: Quarterly sales of a department store for
Q41: Based on quarterly data collected over the
Q42: In the model y<sub>t</sub> = β<sub>0</sub> +
Q43: Which of the following is true of
Q45: The following ratio-to-moving averages for the seasonally
Q46: Quarterly sales of a department store for
Q47: Causal forecasting models are based on a
Q48: If the regression framework is used to
Q49: Using the decomposition model y<sub>t</sub> = T<sub>t</sub>