Multiple Choice
The following table shows the annual revenues (in millions of dollars) of a pharmaceutical company over the period 1990-2011. 
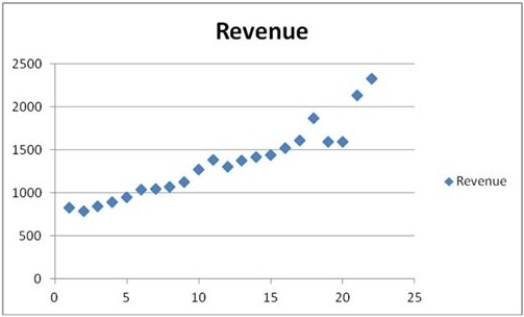 The scatterplot indicates that the annual revenues have an increasing trend. Linear, exponential, quadratic, and cubic models were fit to the data starting with t = 1, and the following output was generated.
  Which of the following is a revenue forecast for 2012 found by the polynomial trend equation with the best fit?
A) About 2 billion and 149 million dollars
B) About 2 billion and 189 million dollars
C) About 2 billion and 337 million dollars
D) About 2 billion and 34 million dollars
Correct Answer:

Verified
Correct Answer:
Verified
Q81: Based on quarterly data collected over the
Q82: The model y<sub>t</sub> = β<sub>0</sub> + β<sub>1</sub>y<sub>t
Q83: The _ method is a smoothing technique
Q84: The following table includes the information about
Q85: The following table includes the information about
Q87: Smoothing techniques are suitable for use when
Q88: The following table includes the information about
Q89: With the method of seasonal dummy variables,
Q90: Quantitative forecasting procedures are based on the
Q91: The following table shows the annual revenues