Solved

The Following Table Shows the Annual Revenues (In Millions of Dollars)

Question 16

Essay

The following table shows the annual revenues (in millions of dollars) of a pharmaceutical company over the period 1990-2011. The following table shows the annual revenues (in millions of dollars) of a pharmaceutical company over the period 1990-2011.   The autoregressive models of order 1 and 2, y<sub>t</sub> = β<sub>0</sub> + β<sub>1</sub>y<sub>t - </sub><sub>1</sub> + ε<sub>t</sub>, and y<sub>t</sub> = β<sub>0</sub> + β<sub>1</sub>y<sub>t - </sub><sub>1</sub> + β<sub>2</sub>y<sub>t - 2</sub> + ε<sub>t</sub>, were applied on the time series to make revenue forecasts. The relevant parts of Excel regression outputs are given below. Model AR(1):     Model AR(2):     When for AR(1), H<sub>0</sub>: β<sub>0</sub> = 0 is tested against H<sub>A</sub>: β<sub>0</sub> ≠ 0, the p-value of this t test shown the output as 0.9590. This could suggest that the model y<sub>t</sub> = β<sub>1</sub>y<sub>t</sub><sub>-1 </sub>+ ε<sub>t</sub> might be an alternative to the AR(1) model y<sub>t</sub> = β<sub>0</sub> + β<sub>1</sub>y<sub>t-1</sub> + ε<sub>t</sub>. Partial output for this simplified model is as follows:     Find the revenue forecast for 2012 through the use of y<sub>t</sub> = β<sub>1</sub>y<sub>t</sub><sub>-1</sub> + ε<sub>t</sub>. 
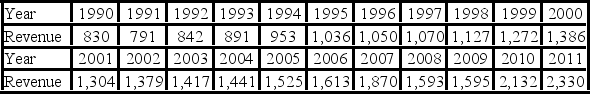
The autoregressive models of order 1 and 2, yt = β0 + β1yt - 1 + εt, and yt = β0 + β1yt - 1 + β2yt - 2 + εt, were applied on the time series to make revenue forecasts. The relevant parts of Excel regression outputs are given below.
Model AR(1): The following table shows the annual revenues (in millions of dollars) of a pharmaceutical company over the period 1990-2011.   The autoregressive models of order 1 and 2, y<sub>t</sub> = β<sub>0</sub> + β<sub>1</sub>y<sub>t - </sub><sub>1</sub> + ε<sub>t</sub>, and y<sub>t</sub> = β<sub>0</sub> + β<sub>1</sub>y<sub>t - </sub><sub>1</sub> + β<sub>2</sub>y<sub>t - 2</sub> + ε<sub>t</sub>, were applied on the time series to make revenue forecasts. The relevant parts of Excel regression outputs are given below. Model AR(1):     Model AR(2):     When for AR(1), H<sub>0</sub>: β<sub>0</sub> = 0 is tested against H<sub>A</sub>: β<sub>0</sub> ≠ 0, the p-value of this t test shown the output as 0.9590. This could suggest that the model y<sub>t</sub> = β<sub>1</sub>y<sub>t</sub><sub>-1 </sub>+ ε<sub>t</sub> might be an alternative to the AR(1) model y<sub>t</sub> = β<sub>0</sub> + β<sub>1</sub>y<sub>t-1</sub> + ε<sub>t</sub>. Partial output for this simplified model is as follows:     Find the revenue forecast for 2012 through the use of y<sub>t</sub> = β<sub>1</sub>y<sub>t</sub><sub>-1</sub> + ε<sub>t</sub>. The following table shows the annual revenues (in millions of dollars) of a pharmaceutical company over the period 1990-2011.   The autoregressive models of order 1 and 2, y<sub>t</sub> = β<sub>0</sub> + β<sub>1</sub>y<sub>t - </sub><sub>1</sub> + ε<sub>t</sub>, and y<sub>t</sub> = β<sub>0</sub> + β<sub>1</sub>y<sub>t - </sub><sub>1</sub> + β<sub>2</sub>y<sub>t - 2</sub> + ε<sub>t</sub>, were applied on the time series to make revenue forecasts. The relevant parts of Excel regression outputs are given below. Model AR(1):     Model AR(2):     When for AR(1), H<sub>0</sub>: β<sub>0</sub> = 0 is tested against H<sub>A</sub>: β<sub>0</sub> ≠ 0, the p-value of this t test shown the output as 0.9590. This could suggest that the model y<sub>t</sub> = β<sub>1</sub>y<sub>t</sub><sub>-1 </sub>+ ε<sub>t</sub> might be an alternative to the AR(1) model y<sub>t</sub> = β<sub>0</sub> + β<sub>1</sub>y<sub>t-1</sub> + ε<sub>t</sub>. Partial output for this simplified model is as follows:     Find the revenue forecast for 2012 through the use of y<sub>t</sub> = β<sub>1</sub>y<sub>t</sub><sub>-1</sub> + ε<sub>t</sub>. Model AR(2): The following table shows the annual revenues (in millions of dollars) of a pharmaceutical company over the period 1990-2011.   The autoregressive models of order 1 and 2, y<sub>t</sub> = β<sub>0</sub> + β<sub>1</sub>y<sub>t - </sub><sub>1</sub> + ε<sub>t</sub>, and y<sub>t</sub> = β<sub>0</sub> + β<sub>1</sub>y<sub>t - </sub><sub>1</sub> + β<sub>2</sub>y<sub>t - 2</sub> + ε<sub>t</sub>, were applied on the time series to make revenue forecasts. The relevant parts of Excel regression outputs are given below. Model AR(1):     Model AR(2):     When for AR(1), H<sub>0</sub>: β<sub>0</sub> = 0 is tested against H<sub>A</sub>: β<sub>0</sub> ≠ 0, the p-value of this t test shown the output as 0.9590. This could suggest that the model y<sub>t</sub> = β<sub>1</sub>y<sub>t</sub><sub>-1 </sub>+ ε<sub>t</sub> might be an alternative to the AR(1) model y<sub>t</sub> = β<sub>0</sub> + β<sub>1</sub>y<sub>t-1</sub> + ε<sub>t</sub>. Partial output for this simplified model is as follows:     Find the revenue forecast for 2012 through the use of y<sub>t</sub> = β<sub>1</sub>y<sub>t</sub><sub>-1</sub> + ε<sub>t</sub>. The following table shows the annual revenues (in millions of dollars) of a pharmaceutical company over the period 1990-2011.   The autoregressive models of order 1 and 2, y<sub>t</sub> = β<sub>0</sub> + β<sub>1</sub>y<sub>t - </sub><sub>1</sub> + ε<sub>t</sub>, and y<sub>t</sub> = β<sub>0</sub> + β<sub>1</sub>y<sub>t - </sub><sub>1</sub> + β<sub>2</sub>y<sub>t - 2</sub> + ε<sub>t</sub>, were applied on the time series to make revenue forecasts. The relevant parts of Excel regression outputs are given below. Model AR(1):     Model AR(2):     When for AR(1), H<sub>0</sub>: β<sub>0</sub> = 0 is tested against H<sub>A</sub>: β<sub>0</sub> ≠ 0, the p-value of this t test shown the output as 0.9590. This could suggest that the model y<sub>t</sub> = β<sub>1</sub>y<sub>t</sub><sub>-1 </sub>+ ε<sub>t</sub> might be an alternative to the AR(1) model y<sub>t</sub> = β<sub>0</sub> + β<sub>1</sub>y<sub>t-1</sub> + ε<sub>t</sub>. Partial output for this simplified model is as follows:     Find the revenue forecast for 2012 through the use of y<sub>t</sub> = β<sub>1</sub>y<sub>t</sub><sub>-1</sub> + ε<sub>t</sub>. When for AR(1), H0: β0 = 0 is tested against HA: β0 ≠ 0, the p-value of this t test shown the output as 0.9590. This could suggest that the model yt = β1yt-1 + εt might be an alternative to the AR(1) model yt = β0 + β1yt-1 + εt. Partial output for this simplified model is as follows: The following table shows the annual revenues (in millions of dollars) of a pharmaceutical company over the period 1990-2011.   The autoregressive models of order 1 and 2, y<sub>t</sub> = β<sub>0</sub> + β<sub>1</sub>y<sub>t - </sub><sub>1</sub> + ε<sub>t</sub>, and y<sub>t</sub> = β<sub>0</sub> + β<sub>1</sub>y<sub>t - </sub><sub>1</sub> + β<sub>2</sub>y<sub>t - 2</sub> + ε<sub>t</sub>, were applied on the time series to make revenue forecasts. The relevant parts of Excel regression outputs are given below. Model AR(1):     Model AR(2):     When for AR(1), H<sub>0</sub>: β<sub>0</sub> = 0 is tested against H<sub>A</sub>: β<sub>0</sub> ≠ 0, the p-value of this t test shown the output as 0.9590. This could suggest that the model y<sub>t</sub> = β<sub>1</sub>y<sub>t</sub><sub>-1 </sub>+ ε<sub>t</sub> might be an alternative to the AR(1) model y<sub>t</sub> = β<sub>0</sub> + β<sub>1</sub>y<sub>t-1</sub> + ε<sub>t</sub>. Partial output for this simplified model is as follows:     Find the revenue forecast for 2012 through the use of y<sub>t</sub> = β<sub>1</sub>y<sub>t</sub><sub>-1</sub> + ε<sub>t</sub>. The following table shows the annual revenues (in millions of dollars) of a pharmaceutical company over the period 1990-2011.   The autoregressive models of order 1 and 2, y<sub>t</sub> = β<sub>0</sub> + β<sub>1</sub>y<sub>t - </sub><sub>1</sub> + ε<sub>t</sub>, and y<sub>t</sub> = β<sub>0</sub> + β<sub>1</sub>y<sub>t - </sub><sub>1</sub> + β<sub>2</sub>y<sub>t - 2</sub> + ε<sub>t</sub>, were applied on the time series to make revenue forecasts. The relevant parts of Excel regression outputs are given below. Model AR(1):     Model AR(2):     When for AR(1), H<sub>0</sub>: β<sub>0</sub> = 0 is tested against H<sub>A</sub>: β<sub>0</sub> ≠ 0, the p-value of this t test shown the output as 0.9590. This could suggest that the model y<sub>t</sub> = β<sub>1</sub>y<sub>t</sub><sub>-1 </sub>+ ε<sub>t</sub> might be an alternative to the AR(1) model y<sub>t</sub> = β<sub>0</sub> + β<sub>1</sub>y<sub>t-1</sub> + ε<sub>t</sub>. Partial output for this simplified model is as follows:     Find the revenue forecast for 2012 through the use of y<sub>t</sub> = β<sub>1</sub>y<sub>t</sub><sub>-1</sub> + ε<sub>t</sub>. Find the revenue forecast for 2012 through the use of yt = β1yt-1 + εt.

Correct Answer:

verifed

Verified

Unlock this answer now
Get Access to more Verified Answers free of charge

Related Questions