Short Answer
Quarterly sales of a department store for the last seven years are given in the following table. 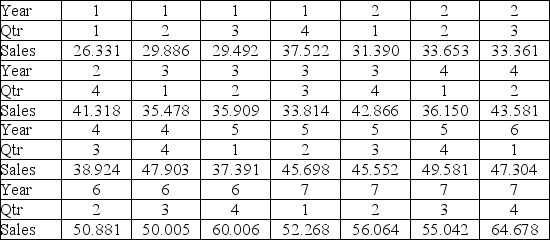
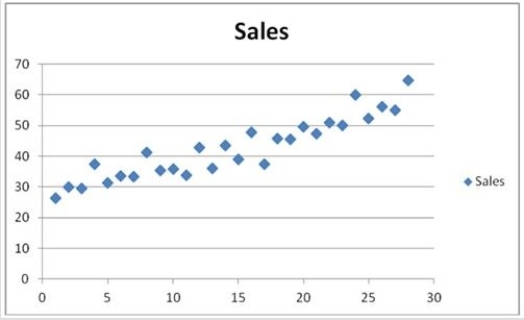 The scatterplot shows that the quarterly sales have an increasing trend and seasonality. A linear regression model given by Sales = β0 + β1Qtr1 + β2Qtr2 + β3Qtr3 + β4t + ε, where t is the time period (t = 1, ..., 28) and Qtr1, Qtr2, and Qtr3 are quarter dummies, is estimated and then used to make forecasts. For the regression model, the following partial output is available.
  Using the regression equation for the linear trend model with seasonal dummy variables, what is the sales forecast for the first quarter of Year 8?
Correct Answer:

Verified
Correct Answer:
Verified
Q32: The mean of the absolute residuals defines
Q33: The following table includes the information about
Q34: When using Excel for calculating moving averages,
Q35: The _ of the adjusted seasonal indices
Q36: In a moving average method, when a
Q38: Although we use the MSE to compare
Q39: The following table shows the annual revenues
Q40: Quarterly sales of a department store for
Q41: Based on quarterly data collected over the
Q42: In the model y<sub>t</sub> = β<sub>0</sub> +