Short Answer
The figure shows a graph of the position of a moving object as a function of time. What is the velocity of the object at each of the following times?
(a) At t = 1.0 s
(b) At t = 2.5 s
(c) At t = 4.0 s
(d) At t = 5.5 s 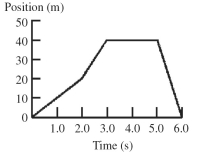
Correct Answer:

Verified
(a) 10 m/s...View Answer
Unlock this answer now
Get Access to more Verified Answers free of charge
Correct Answer:
Verified
(a) 10 m/s...
View Answer
Unlock this answer now
Get Access to more Verified Answers free of charge
Related Questions
Q17: A toy rocket is launched vertically
Q18: A car is able to stop
Q21: A car with good tires on a
Q79: Abby throws a ball straight up and
Q86: Suppose that a car traveling to the
Q92: A laser is thrown upward with a
Q127: Starting from rest,a dragster travels a straight
Q132: If the velocity versus time graph of
Q188: If the acceleration of an object is
Q402: If the velocity of an object is