Short Answer
The figure shows a graph of the velocity of an object as a function of time. What is the acceleration of the object at the following times?
(a) At 1.0 s
(b) At 3.0 s 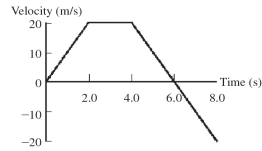
Correct Answer:

Verified
(a) 10 m/s...View Answer
Unlock this answer now
Get Access to more Verified Answers free of charge
Correct Answer:
Verified
(a) 10 m/s...
View Answer
Unlock this answer now
Get Access to more Verified Answers free of charge
Related Questions
Q20: A ball is thrown straight up with
Q31: A certain test car can go from
Q32: What must be your average speed in
Q119: A laser is thrown upward with a
Q139: An auto accelerates forward from 7.0 m/s
Q140: An airplane needs to reach a
Q142: A car moving initially with speed
Q143: A car accelerates from <span
Q146: A car that is initially moving at
Q276: A water rocket can reach a speed