Multiple Choice
The figure shows a graph of the velocity of an object as a function of time. What is the displacement of the object from 0 s to 8.0 s? 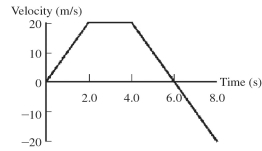
A) 20 m
B) 40 m
C) 60 m
D) 80 m
E) 100 m
Correct Answer:

Verified
Correct Answer:
Verified
Related Questions
Q13: Two objects are thrown from the top
Q49: An object moves 15.0 m north and
Q57: A car is traveling with a constant
Q65: The graph in the figure represents the
Q80: A ball is thrown upward at a
Q89: At the instant a traffic light turns
Q117: A 10-kg rock and a 20-kg rock
Q132: An astronaut stands by the rim of
Q137: Suppose that an object is moving with
Q297: An astronaut on a strange new planet