Multiple Choice
The graph in the figure shows the x component F of the net force that acts for 10 s on a 100-kg crate. What is the change in the momentum of the crate during the 10 s that this force acts? 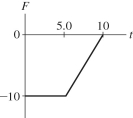
A) -100 kg ∙ m/s
B) -25 kg ∙ m/s
C) 75 kg ∙ m/s
D) -75 kg ∙ m/s
E) 25 kg ∙ m/s
Correct Answer:

Verified
Correct Answer:
Verified
Related Questions
Q8: A 14-cm diameter champagne bottle rests
Q10: A light-weight potter's wheel, having a
Q15: A 900-kg car traveling east at 15.0
Q22: A 0.14-kg baseball is dropped from rest
Q29: A steady horizontal force lasting for 2.1
Q33: In a police ballistics test,a 10.0-g bullet
Q46: A 2.0-kg ball moving eastward at 3.0
Q53: A very elastic rubber ball is dropped
Q60: A figure skater rotating at 5.00 rad/s
Q86: A 100-g ball falls from a window