Short Answer
The figure shows a p diagram for a gas going through a cycle from A to B to C and back to A. From point A to point B, the gas absorbs 50 J of heat and finds its internal (thermal) energy has increased by 20 J. Going from B to C, the internal (thermal) energy decreases by 5.0 J.
(a) How much work was done by the gas from A to B?
(b) How much heat was absorbed by the gas from B to C?
(c) How much work was done by the gas going from B to C? 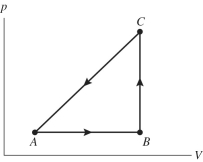
Correct Answer:

Verified
(a) 30 J (...View Answer
Unlock this answer now
Get Access to more Verified Answers free of charge
Correct Answer:
Verified
View Answer
Unlock this answer now
Get Access to more Verified Answers free of charge
Q7: An ideal Carnot engine is operated between
Q9: A fluid in an insulated, flexible
Q10: A gas follows the pV trajectory
Q10: A 10-L flask and a 1-L flask
Q14: Two ideal Carnot heat engines have the
Q36: Which one of the following is a
Q38: A certain automobile engine takes in 4.00
Q46: The temperature in your classroom is closest
Q80: The "hot shot" heat engine operating between
Q103: A temperature change of 20°C corresponds to