Multiple Choice
The figure shows a pV diagram for 0.98 mol of ideal gas that undergoes the process 1 → 2. The gas then undergoes an isochoric heating from point 2 until the pressure is restored to the value it had at point 1. What is the final temperature of the gas? (R = 8.31 J/mol ∙ K) . 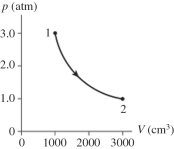
A) -160°C
B) 12°C
C) 380°C
D) 110°C
Correct Answer:

Verified
Correct Answer:
Verified
Related Questions
Q28: Solar houses use a variety of energy
Q50: The water flowing over Niagara Falls drops
Q54: An 920-g piece of iron at 100°C
Q71: The density of water at 0°C is
Q205: What is the average translational kinetic
Q208: How many grams of ice at
Q209: The process shown on the pV diagram
Q212: The temperature of an ideal gas
Q214: A compression at a constant pressure
Q215: The process shown on the pV diagram