Multiple Choice
The figure shows a graph of the position x as a function of time t for a system undergoing simple harmonic motion. Which one of the following graphs represents the velocity of this system as a function of time? 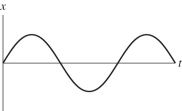 a)
a) 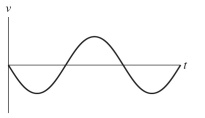
b) 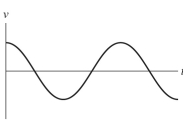
c) 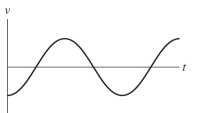
d) 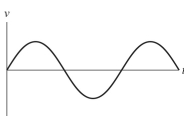
A) graph a
B) graph b
C) graph c
D) graph d
Correct Answer:

Verified
Correct Answer:
Verified
Related Questions
Q16: If the frequency of the motion of
Q28: A 2.0-kg block on a frictionless
Q31: An object undergoing simple harmonic motion
Q34: An object oscillates such that its position
Q36: An object of mass 6.8 kg
Q38: When a laboratory sample of unknown mass
Q45: If a pendulum makes 12 complete swings
Q48: Grandfather clocks are designed so they can
Q60: A pendulum of length L is suspended
Q82: A 0.50-kg box is attached to an