Multiple Choice
The figure shows a graph of the velocity v as a function of time t for a system undergoing simple harmonic motion. Which one of the following graphs represents the acceleration of this system as a function of time? 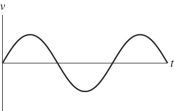 a)
a) 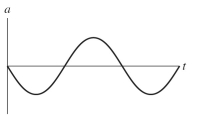
b) 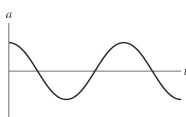
c) 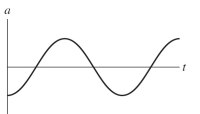
d) 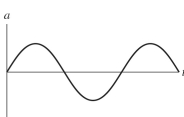
A) graph a
B) graph b
C) graph c
D) graph d
Correct Answer:

Verified
Correct Answer:
Verified
Related Questions
Q3: If your heart is beating at 76.0
Q53: A ball vibrates back and forth from
Q55: An air-track cart is attached to a
Q58: The position of an air-track cart that
Q61: A guitar string is set into vibration
Q89: A spaceship captain lands on an unknown
Q90: The position of an object that is
Q92: A simple pendulum having a bob
Q93: When a certain simple pendulum is set
Q94: A 3.42-kg stone hanging vertically from